Data
83,905 items of data are available, covering 79,378 participants.
Defined-instances run from 2 to 3, labelled using Instancing
2.
Units of measurement are AU.
| Maximum | 0.792604 |
| Decile 9 | 0.328454 |
| Decile 8 | 0.314953 |
| Decile 7 | 0.306392 |
| Decile 6 | 0.299463 |
| Median | 0.293271 |
| Decile 4 | 0.287437 |
| Decile 3 | 0.281248 |
| Decile 2 | 0.27407 |
| Decile 1 | 0.264477 |
| Minimum | 0 |
|
|
- Mean = 0.295512
- Std.dev = 0.0270439
- 20 items below graph minimum of 0.200501
- 348 items above graph maximum of 0.392431
|
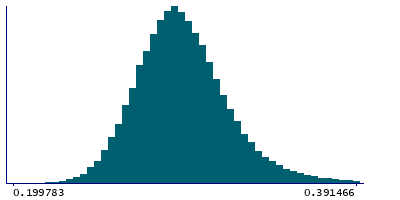
2 Instances
Instance 2 : Imaging visit (2014+)
79,147 participants, 79,147 items
| Maximum | 0.792604 |
| Decile 9 | 0.328357 |
| Decile 8 | 0.314844 |
| Decile 7 | 0.306295 |
| Decile 6 | 0.299294 |
| Median | 0.293126 |
| Decile 4 | 0.287269 |
| Decile 3 | 0.281092 |
| Decile 2 | 0.273908 |
| Decile 1 | 0.264309 |
| Minimum | 0 |
|

|
- Mean = 0.295382
- Std.dev = 0.0270817
- 18 items below graph minimum of 0.200261
- 331 items above graph maximum of 0.392404
|
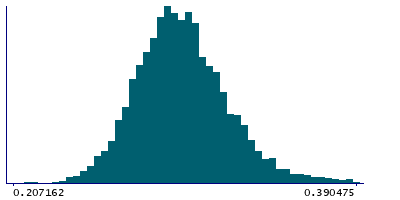
Instance 3 : First repeat imaging visit (2019+)
4,758 participants, 4,758 items
| Maximum | 0.478384 |
| Decile 9 | 0.329377 |
| Decile 8 | 0.316502 |
| Decile 7 | 0.308201 |
| Decile 6 | 0.30169 |
| Median | 0.295676 |
| Decile 4 | 0.289819 |
| Decile 3 | 0.284254 |
| Decile 2 | 0.277186 |
| Decile 1 | 0.26827 |
| Minimum | 0 |
|
|
- Mean = 0.29768
- Std.dev = 0.0263124
- 2 items below graph minimum of 0.207163
- 20 items above graph maximum of 0.390484
|
Notes
Weighted-mean OD (orientation dispersion index) in tract left parahippocampal part of cingulum (from dMRI data)
0 Related Data-Fields
There are no related data-fields

