Data
83,905 items of data are available, covering 79,378 participants.
Defined-instances run from 2 to 3, labelled using Instancing
2.
Units of measurement are AU.
| Maximum | 0.377969 |
| Decile 9 | 0.207104 |
| Decile 8 | 0.202679 |
| Decile 7 | 0.199529 |
| Decile 6 | 0.196903 |
| Median | 0.19445 |
| Decile 4 | 0.191932 |
| Decile 3 | 0.189268 |
| Decile 2 | 0.186208 |
| Decile 1 | 0.181793 |
| Minimum | 0 |
|

|
- Mean = 0.194459
- Std.dev = 0.0104157
- 22 items below graph minimum of 0.156483
- 49 items above graph maximum of 0.232414
|
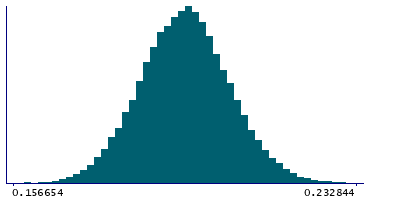
2 Instances
Instance 2 : Imaging visit (2014+)
79,147 participants, 79,147 items
| Maximum | 0.377969 |
| Decile 9 | 0.207126 |
| Decile 8 | 0.202687 |
| Decile 7 | 0.199525 |
| Decile 6 | 0.196891 |
| Median | 0.194435 |
| Decile 4 | 0.191912 |
| Decile 3 | 0.189244 |
| Decile 2 | 0.186181 |
| Decile 1 | 0.181753 |
| Minimum | 0 |
|
|
- Mean = 0.194448
- Std.dev = 0.0104216
- 20 items below graph minimum of 0.15638
- 46 items above graph maximum of 0.232498
|
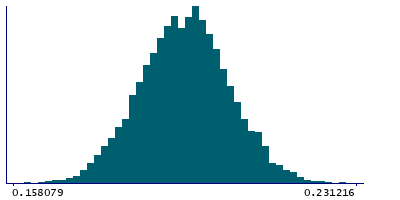
Instance 3 : First repeat imaging visit (2019+)
4,758 participants, 4,758 items
| Maximum | 0.357442 |
| Decile 9 | 0.206841 |
| Decile 8 | 0.202542 |
| Decile 7 | 0.199576 |
| Decile 6 | 0.197084 |
| Median | 0.194748 |
| Decile 4 | 0.19223 |
| Decile 3 | 0.189662 |
| Decile 2 | 0.18661 |
| Decile 1 | 0.182441 |
| Minimum | 0 |
|
|
- Mean = 0.194628
- Std.dev = 0.0103157
- 2 items below graph minimum of 0.158042
- 3 items above graph maximum of 0.23124
|
Notes
Weighted-mean OD (orientation dispersion index) in tract forceps minor (from dMRI data)
0 Related Data-Fields
There are no related data-fields

