Data
64,941 items of data are available, covering 60,413 participants.
Defined-instances run from 2 to 3, labelled using Instancing
2.
Units of measurement are AU.
| Maximum | 0.373305 |
| Decile 9 | 0.178939 |
| Decile 8 | 0.173945 |
| Decile 7 | 0.170468 |
| Decile 6 | 0.167629 |
| Median | 0.164966 |
| Decile 4 | 0.162443 |
| Decile 3 | 0.159723 |
| Decile 2 | 0.156626 |
| Decile 1 | 0.152557 |
| Minimum | 0 |
|

|
- Mean = 0.16543
- Std.dev = 0.0109978
- 23 items below graph minimum of 0.126175
- 71 items above graph maximum of 0.20532
|
2 Instances
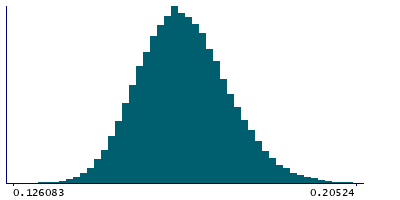
Instance 2 : Imaging visit (2014+)
60,181 participants, 60,181 items
| Maximum | 0.373305 |
| Decile 9 | 0.178854 |
| Decile 8 | 0.173832 |
| Decile 7 | 0.170363 |
| Decile 6 | 0.16752 |
| Median | 0.164843 |
| Decile 4 | 0.162343 |
| Decile 3 | 0.159622 |
| Decile 2 | 0.156525 |
| Decile 1 | 0.152468 |
| Minimum | 0 |
|
|
- Mean = 0.165331
- Std.dev = 0.0110016
- 21 items below graph minimum of 0.126083
- 67 items above graph maximum of 0.20524
|
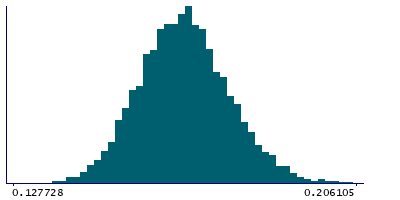
Instance 3 : First repeat imaging visit (2019+)
4,760 participants, 4,760 items
| Maximum | 0.263345 |
| Decile 9 | 0.179979 |
| Decile 8 | 0.1752 |
| Decile 7 | 0.171686 |
| Decile 6 | 0.168907 |
| Median | 0.166497 |
| Decile 4 | 0.163915 |
| Decile 3 | 0.161253 |
| Decile 2 | 0.158167 |
| Decile 1 | 0.153853 |
| Minimum | 0 |
|
|
- Mean = 0.166691
- Std.dev = 0.0108712
- 2 items below graph minimum of 0.127728
- 4 items above graph maximum of 0.206105
|
Notes
Weighted-mean OD (orientation dispersion index) in tract left inferior fronto-occipital fasciculus (from dMRI data)
0 Related Data-Fields
There are no related data-fields

