Data
83,905 items of data are available, covering 79,378 participants.
Defined-instances run from 2 to 3, labelled using Instancing
2.
Units of measurement are AU.
| Maximum | 0.377945 |
| Decile 9 | 0.199156 |
| Decile 8 | 0.194349 |
| Decile 7 | 0.191015 |
| Decile 6 | 0.188172 |
| Median | 0.185553 |
| Decile 4 | 0.182943 |
| Decile 3 | 0.180251 |
| Decile 2 | 0.177085 |
| Decile 1 | 0.172696 |
| Minimum | 0 |
|
|
- Mean = 0.185774
- Std.dev = 0.0109808
- 26 items below graph minimum of 0.146235
- 66 items above graph maximum of 0.225617
|
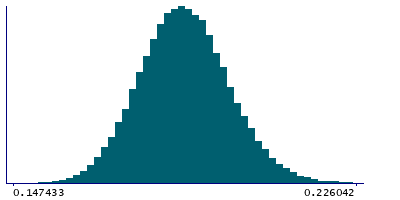
2 Instances
Instance 2 : Imaging visit (2014+)
79,147 participants, 79,147 items
| Maximum | 0.377945 |
| Decile 9 | 0.198955 |
| Decile 8 | 0.194137 |
| Decile 7 | 0.190797 |
| Decile 6 | 0.187944 |
| Median | 0.18535 |
| Decile 4 | 0.182745 |
| Decile 3 | 0.180058 |
| Decile 2 | 0.176878 |
| Decile 1 | 0.17251 |
| Minimum | 0 |
|

|
- Mean = 0.185581
- Std.dev = 0.0109495
- 23 items below graph minimum of 0.146065
- 67 items above graph maximum of 0.2254
|
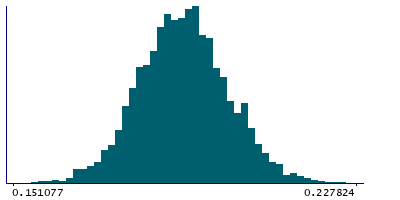
Instance 3 : First repeat imaging visit (2019+)
4,758 participants, 4,758 items
| Maximum | 0.234755 |
| Decile 9 | 0.202241 |
| Decile 8 | 0.197311 |
| Decile 7 | 0.194055 |
| Decile 6 | 0.191423 |
| Median | 0.188975 |
| Decile 4 | 0.186381 |
| Decile 3 | 0.183901 |
| Decile 2 | 0.180634 |
| Decile 1 | 0.176656 |
| Minimum | 0 |
|
|
- Mean = 0.188995
- Std.dev = 0.0109992
- 3 items below graph minimum of 0.15107
- 2 items above graph maximum of 0.227826
|
Notes
Weighted-mean OD (orientation dispersion index) in tract right posterior thalamic radiation (from dMRI data)
0 Related Data-Fields
There are no related data-fields

