Data
55,977 items of data are available, covering 52,115 participants.
Defined-instances run from 2 to 3, labelled using Instancing
2.
Units of measurement are AU.
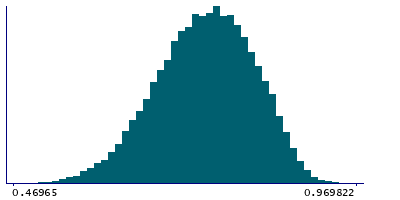
| Maximum | 0.969822 |
| Decile 9 | 0.839279 |
| Decile 8 | 0.811752 |
| Decile 7 | 0.790507 |
| Decile 6 | 0.771043 |
| Median | 0.75245 |
| Decile 4 | 0.733032 |
| Decile 3 | 0.712366 |
| Decile 2 | 0.688181 |
| Decile 1 | 0.654464 |
| Minimum | 0.445239 |
|
|
- Mean = 0.748918
- Std.dev = 0.0707855
- 4 items below graph minimum of 0.46965
|
2 Instances
Instance 2 : Imaging visit (2014+)
51,691 participants, 51,691 items
| Maximum | 0.969822 |
| Decile 9 | 0.839186 |
| Decile 8 | 0.811628 |
| Decile 7 | 0.790077 |
| Decile 6 | 0.770703 |
| Median | 0.752004 |
| Decile 4 | 0.732482 |
| Decile 3 | 0.711823 |
| Decile 2 | 0.687647 |
| Decile 1 | 0.65381 |
| Minimum | 0.445239 |
|

|
- Mean = 0.748501
- Std.dev = 0.0709366
- 4 items below graph minimum of 0.468434
|
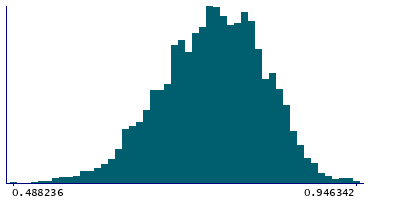
Instance 3 : First repeat imaging visit (2019+)
4,286 participants, 4,286 items
| Maximum | 0.946342 |
| Decile 9 | 0.840345 |
| Decile 8 | 0.813199 |
| Decile 7 | 0.794547 |
| Decile 6 | 0.775558 |
| Median | 0.757311 |
| Decile 4 | 0.740009 |
| Decile 3 | 0.718571 |
| Decile 2 | 0.69653 |
| Decile 1 | 0.662619 |
| Minimum | 0.488236 |
|
|
- Mean = 0.75394
- Std.dev = 0.0687378
|