Data
51,610 items of data are available, covering 46,924 participants.
Defined-instances run from 2 to 3, labelled using Instancing
2.
Units of measurement are AU.
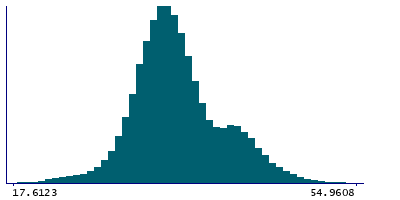
| Maximum | 59.2446 |
| Decile 9 | 42.511 |
| Decile 8 | 39.4603 |
| Decile 7 | 37.2326 |
| Decile 6 | 35.9182 |
| Median | 34.8567 |
| Decile 4 | 33.8837 |
| Decile 3 | 32.8951 |
| Decile 2 | 31.7355 |
| Decile 1 | 30.0622 |
| Minimum | 12.6093 |
|
|
- Mean = 35.48
- Std.dev = 4.94326
- 8 items below graph minimum of 17.6134
- 16 items above graph maximum of 54.9598
|
2 Instances
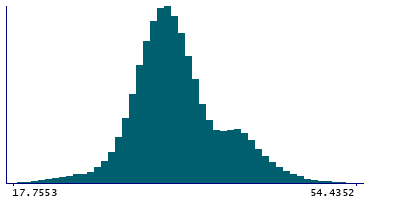
Instance 2 : Imaging visit (2014+)
46,852 participants, 46,852 items
| Maximum | 59.2446 |
| Decile 9 | 42.5275 |
| Decile 8 | 39.4622 |
| Decile 7 | 37.225 |
| Decile 6 | 35.9008 |
| Median | 34.846 |
| Decile 4 | 33.8769 |
| Decile 3 | 32.8923 |
| Decile 2 | 31.7296 |
| Decile 1 | 30.0586 |
| Minimum | 12.6093 |
|
|
- Mean = 35.4771
- Std.dev = 4.9451
- 7 items below graph minimum of 17.5897
- 13 items above graph maximum of 54.9964
|
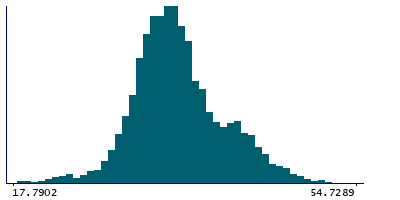
Instance 3 : First repeat imaging visit (2019+)
4,758 participants, 4,758 items
| Maximum | 56.9653 |
| Decile 9 | 42.416 |
| Decile 8 | 39.453 |
| Decile 7 | 37.3533 |
| Decile 6 | 36.0404 |
| Median | 34.9564 |
| Decile 4 | 33.9952 |
| Decile 3 | 32.9398 |
| Decile 2 | 31.7894 |
| Decile 1 | 30.1031 |
| Minimum | 17.4235 |
|
|
- Mean = 35.5093
- Std.dev = 4.92502
- 1 item below graph minimum of 17.7902
- 2 items above graph maximum of 54.7289
|
Notes
Mean intensity of 3rd-Ventricle in the whole brain generated by subcortical volumetric segmentation (aseg)
0 Related Data-Fields
There are no related data-fields
0 Resources
There are no matching Resources
