Data
51,610 items of data are available, covering 46,924 participants.
Defined-instances run from 2 to 3, labelled using Instancing
2.
Units of measurement are AU.
| Maximum | 97 |
| Decile 9 | 64.3333 |
| Decile 8 | 63 |
| Decile 7 | 61.8 |
| Decile 6 | 60.7273 |
| Median | 59.6 |
| Decile 4 | 58.4167 |
| Decile 3 | 57 |
| Decile 2 | 55.0909 |
| Decile 1 | 51.7179 |
| Minimum | 0 |
|

|
- Mean = 57.1724
- Std.dev = 11.6372
- 1795 items below graph minimum of 39.1025
- 24 items above graph maximum of 76.9487
|
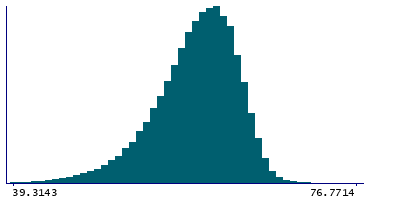
2 Instances
Instance 2 : Imaging visit (2014+)
46,852 participants, 46,852 items
| Maximum | 97 |
| Decile 9 | 64.3 |
| Decile 8 | 62.9592 |
| Decile 7 | 61.7778 |
| Decile 6 | 60.7 |
| Median | 59.5882 |
| Decile 4 | 58.4 |
| Decile 3 | 57 |
| Decile 2 | 55.0833 |
| Decile 1 | 51.7375 |
| Minimum | 0 |
|
|
- Mean = 57.1908
- Std.dev = 11.5545
- 1606 items below graph minimum of 39.1749
- 24 items above graph maximum of 76.8625
|
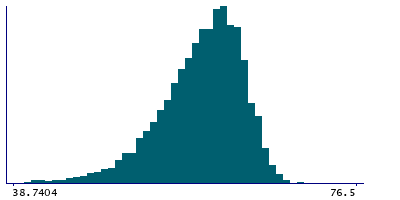
Instance 3 : First repeat imaging visit (2019+)
4,758 participants, 4,758 items
| Maximum | 76.5 |
| Decile 9 | 64.3636 |
| Decile 8 | 63.1111 |
| Decile 7 | 62 |
| Decile 6 | 61 |
| Median | 59.8 |
| Decile 4 | 58.5613 |
| Decile 3 | 57.0801 |
| Decile 2 | 55.1381 |
| Decile 1 | 51.552 |
| Minimum | 0 |
|
|
- Mean = 56.9913
- Std.dev = 12.4207
- 191 items below graph minimum of 38.7404
|
Notes
Mean intensity of vessel in the right hemisphere generated by subcortical volumetric segmentation (aseg)
0 Related Data-Fields
There are no related data-fields
0 Resources
There are no matching Resources
