Data
87,996 items of data are available, covering 83,313 participants.
Defined-instances run from 2 to 3, labelled using Instancing
2.
Units of measurement are mm3.
| Maximum | 754.313 |
| Decile 9 | 475.727 |
| Decile 8 | 450.108 |
| Decile 7 | 432.517 |
| Decile 6 | 418.056 |
| Median | 404.904 |
| Decile 4 | 391.995 |
| Decile 3 | 378.669 |
| Decile 2 | 363.224 |
| Decile 1 | 342.152 |
| Minimum | 105.192 |
|

|
- Mean = 407.141
- Std.dev = 53.0323
- 18 items below graph minimum of 208.576
- 38 items above graph maximum of 609.302
|
2 Instances
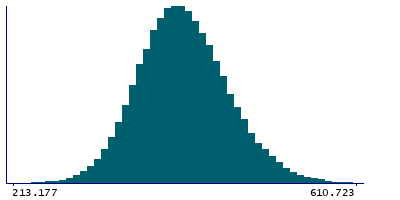
Instance 2 : Imaging visit (2014+)
83,241 participants, 83,241 items
| Maximum | 754.313 |
| Decile 9 | 475.445 |
| Decile 8 | 449.854 |
| Decile 7 | 432.285 |
| Decile 6 | 417.727 |
| Median | 404.569 |
| Decile 4 | 391.749 |
| Decile 3 | 378.343 |
| Decile 2 | 362.784 |
| Decile 1 | 341.758 |
| Minimum | 145.243 |
|
|
- Mean = 406.808
- Std.dev = 53.0435
- 13 items below graph minimum of 208.07
- 36 items above graph maximum of 609.133
|
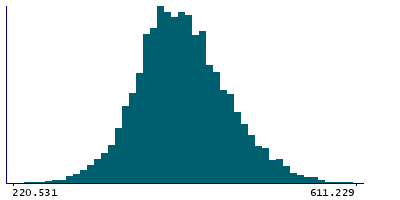
Instance 3 : First repeat imaging visit (2019+)
4,755 participants, 4,755 items
| Maximum | 635.055 |
| Decile 9 | 480.996 |
| Decile 8 | 455.346 |
| Decile 7 | 436.863 |
| Decile 6 | 422.84 |
| Median | 410.235 |
| Decile 4 | 397.447 |
| Decile 3 | 385.184 |
| Decile 2 | 371.262 |
| Decile 1 | 350.764 |
| Minimum | 105.192 |
|
|
- Mean = 412.978
- Std.dev = 52.4946
- 7 items below graph minimum of 220.531
- 3 items above graph maximum of 611.229
|
Notes
Volume of Basal-nucleus in the left hemisphere generated by subcortical volumetric sub-segmentation of the Amygdala Nuclei
0 Related Data-Fields
There are no related data-fields
0 Resources
There are no matching Resources
