Data
87,996 items of data are available, covering 83,313 participants.
Defined-instances run from 2 to 3, labelled using Instancing
2.
Units of measurement are mm3.
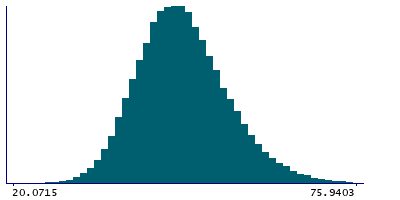
| Maximum | 87.1163 |
| Decile 9 | 56.9381 |
| Decile 8 | 53.158 |
| Decile 7 | 50.636 |
| Decile 6 | 48.5705 |
| Median | 46.7517 |
| Decile 4 | 44.962 |
| Decile 3 | 43.1412 |
| Decile 2 | 41.0693 |
| Decile 1 | 38.3061 |
| Minimum | 11.321 |
|
|
- Mean = 47.2691
- Std.dev = 7.41208
- 3 items below graph minimum of 19.674
- 92 items above graph maximum of 75.5702
|
2 Instances
Instance 2 : Imaging visit (2014+)
83,241 participants, 83,241 items
| Maximum | 87.1163 |
| Decile 9 | 56.8907 |
| Decile 8 | 53.1103 |
| Decile 7 | 50.586 |
| Decile 6 | 48.5326 |
| Median | 46.7091 |
| Decile 4 | 44.9162 |
| Decile 3 | 43.0869 |
| Decile 2 | 41.0086 |
| Decile 1 | 38.2628 |
| Minimum | 18.221 |
|

|
- Mean = 47.224
- Std.dev = 7.41435
- 2 items below graph minimum of 19.6349
- 90 items above graph maximum of 75.5185
|
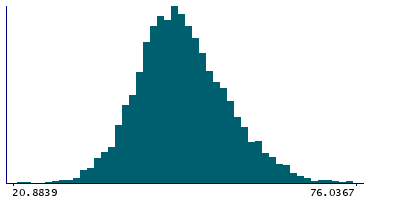
Instance 3 : First repeat imaging visit (2019+)
4,755 participants, 4,755 items
| Maximum | 82.5183 |
| Decile 9 | 57.6524 |
| Decile 8 | 54.028 |
| Decile 7 | 51.3293 |
| Decile 6 | 49.2897 |
| Median | 47.5132 |
| Decile 4 | 45.8512 |
| Decile 3 | 44.063 |
| Decile 2 | 42.1554 |
| Decile 1 | 39.2682 |
| Minimum | 11.321 |
|
|
- Mean = 48.0591
- Std.dev = 7.32727
- 4 items below graph minimum of 20.8839
- 5 items above graph maximum of 76.0367
|
Notes
Volume of Anterior-amygdaloid-area-AAA in the left hemisphere generated by subcortical volumetric sub-segmentation of the Amygdala Nuclei
0 Related Data-Fields
There are no related data-fields
0 Resources
There are no matching Resources
