Data
68,381 items of data are available, covering 63,696 participants.
Defined-instances run from 2 to 3, labelled using Instancing
2.
Units of measurement are mm3.
| Maximum | 714.362 |
| Decile 9 | 324.955 |
| Decile 8 | 307.895 |
| Decile 7 | 295.922 |
| Decile 6 | 285.974 |
| Median | 276.744 |
| Decile 4 | 268.007 |
| Decile 3 | 258.838 |
| Decile 2 | 248.369 |
| Decile 1 | 233.773 |
| Minimum | 74.6683 |
|
|
- Mean = 278.386
- Std.dev = 36.2515
- 9 items below graph minimum of 142.591
- 39 items above graph maximum of 416.137
|
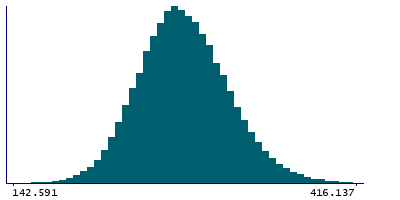
2 Instances
Instance 2 : Imaging visit (2014+)
63,624 participants, 63,624 items
| Maximum | 714.362 |
| Decile 9 | 324.724 |
| Decile 8 | 307.593 |
| Decile 7 | 295.705 |
| Decile 6 | 285.733 |
| Median | 276.553 |
| Decile 4 | 267.762 |
| Decile 3 | 258.573 |
| Decile 2 | 248.097 |
| Decile 1 | 233.469 |
| Minimum | 74.6683 |
|

|
- Mean = 278.14
- Std.dev = 36.2994
- 9 items below graph minimum of 142.214
- 35 items above graph maximum of 415.98
|
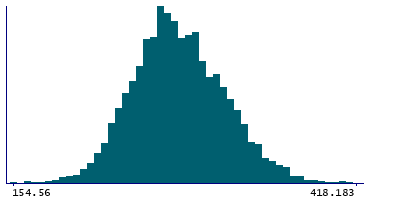
Instance 3 : First repeat imaging visit (2019+)
4,757 participants, 4,757 items
| Maximum | 452.572 |
| Decile 9 | 328.003 |
| Decile 8 | 311.599 |
| Decile 7 | 298.652 |
| Decile 6 | 289.203 |
| Median | 279.347 |
| Decile 4 | 270.737 |
| Decile 3 | 262.279 |
| Decile 2 | 252.324 |
| Decile 1 | 237.824 |
| Minimum | 154.56 |
|
|
- Mean = 281.687
- Std.dev = 35.4398
- 4 items above graph maximum of 418.183
|
Notes
Volume of subiculum-body in the right hemisphere generated by subcortical volumetric sub-segmentation of the Hippocampal Subfields
0 Related Data-Fields
There are no related data-fields
0 Resources
There are no matching Resources
