Data
87,996 items of data are available, covering 83,313 participants.
Defined-instances run from 2 to 3, labelled using Instancing
2.
Units of measurement are mm3.
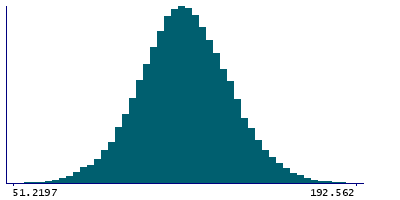
| Maximum | 263.846 |
| Decile 9 | 144.617 |
| Decile 8 | 136.311 |
| Decile 7 | 130.293 |
| Decile 6 | 125.236 |
| Median | 120.674 |
| Decile 4 | 116.167 |
| Decile 3 | 111.3 |
| Decile 2 | 105.486 |
| Decile 1 | 97.3145 |
| Minimum | 22.7906 |
|
|
- Mean = 120.855
- Std.dev = 18.7631
- 30 items below graph minimum of 50.0119
- 26 items above graph maximum of 191.92
|
2 Instances
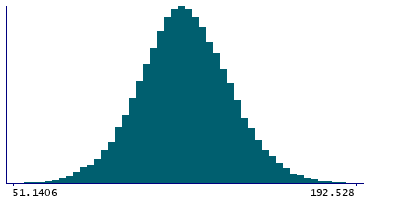
Instance 2 : Imaging visit (2014+)
83,241 participants, 83,241 items
| Maximum | 263.846 |
| Decile 9 | 144.52 |
| Decile 8 | 136.219 |
| Decile 7 | 130.191 |
| Decile 6 | 125.122 |
| Median | 120.563 |
| Decile 4 | 116.074 |
| Decile 3 | 111.211 |
| Decile 2 | 105.405 |
| Decile 1 | 97.2327 |
| Minimum | 22.7906 |
|
|
- Mean = 120.759
- Std.dev = 18.7669
- 29 items below graph minimum of 49.9451
- 25 items above graph maximum of 191.808
|
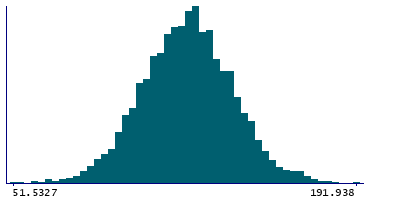
Instance 3 : First repeat imaging visit (2019+)
4,755 participants, 4,755 items
| Maximum | 191.938 |
| Decile 9 | 145.989 |
| Decile 8 | 138.139 |
| Decile 7 | 132.091 |
| Decile 6 | 127.041 |
| Median | 122.794 |
| Decile 4 | 117.969 |
| Decile 3 | 113.119 |
| Decile 2 | 107.148 |
| Decile 1 | 98.761 |
| Minimum | 48.5313 |
|
|
- Mean = 122.536
- Std.dev = 18.6171
- 1 item below graph minimum of 51.5327
|
Notes
Volume of CA3-body in the right hemisphere generated by subcortical volumetric sub-segmentation of the Hippocampal Subfields
0 Related Data-Fields
There are no related data-fields
0 Resources
There are no matching Resources
