Data
87,996 items of data are available, covering 83,313 participants.
Defined-instances run from 2 to 3, labelled using Instancing
2.
Units of measurement are mm3.
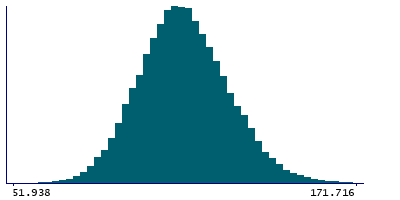
| Maximum | 497.02 |
| Decile 9 | 130.544 |
| Decile 8 | 123.117 |
| Decile 7 | 117.933 |
| Decile 6 | 113.62 |
| Median | 109.712 |
| Decile 4 | 105.911 |
| Decile 3 | 101.889 |
| Decile 2 | 97.2068 |
| Decile 1 | 90.8085 |
| Minimum | 35.0161 |
|
|
- Mean = 110.292
- Std.dev = 15.7807
- 11 items below graph minimum of 51.0726
- 58 items above graph maximum of 170.28
|
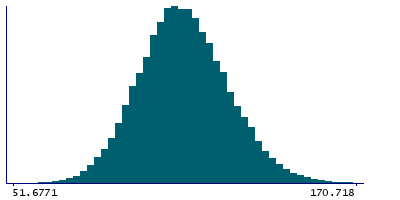
2 Instances
Instance 2 : Imaging visit (2014+)
83,241 participants, 83,241 items
| Maximum | 367.041 |
| Decile 9 | 130.485 |
| Decile 8 | 123.083 |
| Decile 7 | 117.905 |
| Decile 6 | 113.578 |
| Median | 109.649 |
| Decile 4 | 105.836 |
| Decile 3 | 101.81 |
| Decile 2 | 97.1261 |
| Decile 1 | 90.721 |
| Minimum | 35.0161 |
|
|
- Mean = 110.229
- Std.dev = 15.7263
- 11 items below graph minimum of 50.9567
- 54 items above graph maximum of 170.25
|
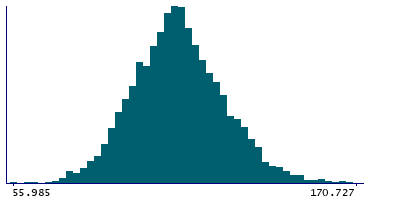
Instance 3 : First repeat imaging visit (2019+)
4,755 participants, 4,755 items
| Maximum | 497.02 |
| Decile 9 | 131.471 |
| Decile 8 | 123.645 |
| Decile 7 | 118.422 |
| Decile 6 | 114.172 |
| Median | 110.701 |
| Decile 4 | 107.213 |
| Decile 3 | 103.302 |
| Decile 2 | 98.4256 |
| Decile 1 | 92.2385 |
| Minimum | 55.985 |
|
|
- Mean = 111.4
- Std.dev = 16.665
- 4 items above graph maximum of 170.703
|
Notes
Volume of MGN in the left hemisphere generated by subcortical volumetric sub-segmentation of the Thalamic Nuclei
0 Related Data-Fields
There are no related data-fields
0 Resources
There are no matching Resources
