Data
68,381 items of data are available, covering 63,696 participants.
Defined-instances run from 2 to 3, labelled using Instancing
2.
Units of measurement are mm3.
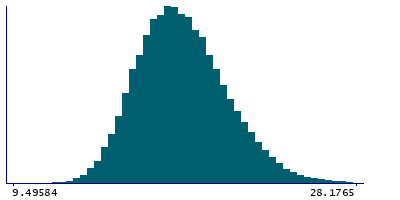
| Maximum | 48.7683 |
| Decile 9 | 21.9496 |
| Decile 8 | 20.6927 |
| Decile 7 | 19.8408 |
| Decile 6 | 19.1411 |
| Median | 18.5075 |
| Decile 4 | 17.9087 |
| Decile 3 | 17.2824 |
| Decile 2 | 16.6062 |
| Decile 1 | 15.7227 |
| Minimum | 9.20491 |
|
|
- Mean = 18.6989
- Std.dev = 2.45602
- 1 item below graph minimum of 9.49584
- 48 items above graph maximum of 28.1765
|
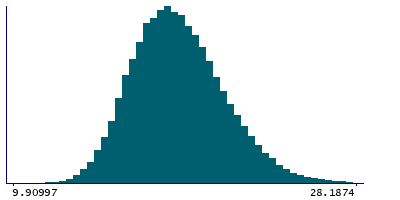
2 Instances
Instance 2 : Imaging visit (2014+)
63,624 participants, 63,624 items
| Maximum | 48.7683 |
| Decile 9 | 21.9512 |
| Decile 8 | 20.6953 |
| Decile 7 | 19.8429 |
| Decile 6 | 19.1386 |
| Median | 18.5069 |
| Decile 4 | 17.9092 |
| Decile 3 | 17.2803 |
| Decile 2 | 16.6034 |
| Decile 1 | 15.715 |
| Minimum | 9.90997 |
|
|
- Mean = 18.6979
- Std.dev = 2.45475
- 44 items above graph maximum of 28.1874
|
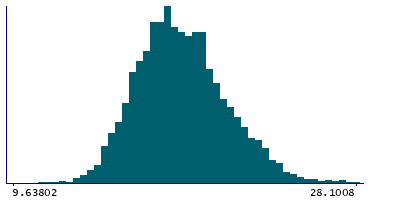
Instance 3 : First repeat imaging visit (2019+)
4,757 participants, 4,757 items
| Maximum | 47.823 |
| Decile 9 | 21.9465 |
| Decile 8 | 20.648 |
| Decile 7 | 19.8056 |
| Decile 6 | 19.1653 |
| Median | 18.5159 |
| Decile 4 | 17.9048 |
| Decile 3 | 17.3138 |
| Decile 2 | 16.6503 |
| Decile 1 | 15.7923 |
| Minimum | 9.20491 |
|
|
- Mean = 18.7119
- Std.dev = 2.47285
- 1 item below graph minimum of 9.63802
- 4 items above graph maximum of 28.1008
|
Notes
Volume of VM in the left hemisphere generated by subcortical volumetric sub-segmentation of the Thalamic Nuclei
0 Related Data-Fields
There are no related data-fields
0 Resources
There are no matching Resources
