Data
68,381 items of data are available, covering 63,696 participants.
Defined-instances run from 2 to 3, labelled using Instancing
2.
Units of measurement are mm3.
| Maximum | 1966.43 |
| Decile 9 | 866.473 |
| Decile 8 | 822.826 |
| Decile 7 | 792.972 |
| Decile 6 | 767.989 |
| Median | 745.629 |
| Decile 4 | 723.728 |
| Decile 3 | 701.442 |
| Decile 2 | 676.238 |
| Decile 1 | 643.082 |
| Minimum | 393.997 |
|
|
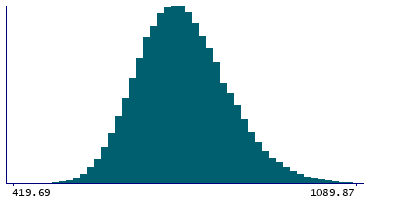
- Mean = 751.18
- Std.dev = 88.3517
- 1 item below graph minimum of 419.69
- 50 items above graph maximum of 1089.87
|
2 Instances
Instance 2 : Imaging visit (2014+)
63,624 participants, 63,624 items
| Maximum | 1966.43 |
| Decile 9 | 866.341 |
| Decile 8 | 822.567 |
| Decile 7 | 792.774 |
| Decile 6 | 767.775 |
| Median | 745.416 |
| Decile 4 | 723.461 |
| Decile 3 | 701.124 |
| Decile 2 | 676.045 |
| Decile 1 | 642.888 |
| Minimum | 393.997 |
|

|
- Mean = 750.956
- Std.dev = 88.2597
- 1 item below graph minimum of 419.435
- 46 items above graph maximum of 1089.79
|
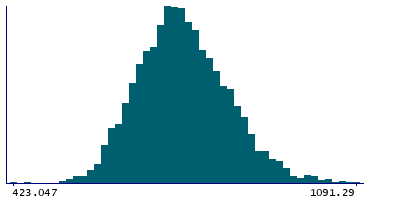
Instance 3 : First repeat imaging visit (2019+)
4,757 participants, 4,757 items
| Maximum | 1744.42 |
| Decile 9 | 868.542 |
| Decile 8 | 826.477 |
| Decile 7 | 795.256 |
| Decile 6 | 770.294 |
| Median | 748.425 |
| Decile 4 | 727.916 |
| Decile 3 | 705.896 |
| Decile 2 | 679.134 |
| Decile 1 | 645.794 |
| Minimum | 422.949 |
|
|
- Mean = 754.177
- Std.dev = 89.5188
- 1 item below graph minimum of 423.047
- 5 items above graph maximum of 1091.29
|
Notes
Volume of VLp in the left hemisphere generated by subcortical volumetric sub-segmentation of the Thalamic Nuclei
0 Related Data-Fields
There are no related data-fields
0 Resources
There are no matching Resources
