Data
87,996 items of data are available, covering 83,313 participants.
Defined-instances run from 2 to 3, labelled using Instancing
2.
Units of measurement are mm3.
| Maximum | 658.074 |
| Decile 9 | 249.68 |
| Decile 8 | 238.18 |
| Decile 7 | 230.199 |
| Decile 6 | 223.637 |
| Median | 217.427 |
| Decile 4 | 211.482 |
| Decile 3 | 205.266 |
| Decile 2 | 198.202 |
| Decile 1 | 188.698 |
| Minimum | 110.32 |
|
|
- Mean = 218.541
- Std.dev = 24.1788
- 10 items below graph minimum of 127.716
- 90 items above graph maximum of 310.662
|
2 Instances
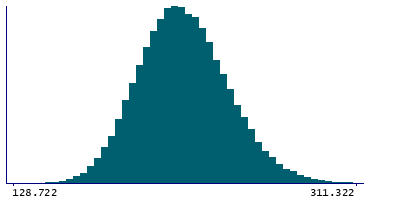
Instance 2 : Imaging visit (2014+)
83,241 participants, 83,241 items
| Maximum | 658.074 |
| Decile 9 | 249.532 |
| Decile 8 | 238.085 |
| Decile 7 | 230.085 |
| Decile 6 | 223.529 |
| Median | 217.341 |
| Decile 4 | 211.355 |
| Decile 3 | 205.134 |
| Decile 2 | 198.078 |
| Decile 1 | 188.593 |
| Minimum | 110.32 |
|

|
- Mean = 218.434
- Std.dev = 24.1849
- 8 items below graph minimum of 127.653
- 88 items above graph maximum of 310.472
|
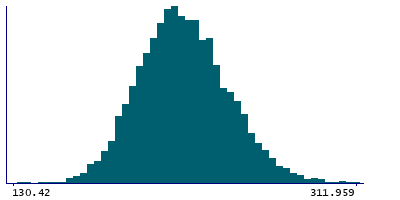
Instance 3 : First repeat imaging visit (2019+)
4,755 participants, 4,755 items
| Maximum | 427.931 |
| Decile 9 | 251.446 |
| Decile 8 | 239.942 |
| Decile 7 | 232.167 |
| Decile 6 | 225.508 |
| Median | 219.249 |
| Decile 4 | 213.373 |
| Decile 3 | 207.416 |
| Decile 2 | 200.226 |
| Decile 1 | 190.933 |
| Minimum | 122.558 |
|
|
- Mean = 220.426
- Std.dev = 23.9946
- 2 items below graph minimum of 130.42
- 3 items above graph maximum of 311.959
|
Notes
Volume of PuA in the right hemisphere generated by subcortical volumetric sub-segmentation of the Thalamic Nuclei
0 Related Data-Fields
There are no related data-fields
0 Resources
There are no matching Resources
