Data
87,996 items of data are available, covering 83,313 participants.
Defined-instances run from 2 to 3, labelled using Instancing
2.
Units of measurement are mm3.
| Maximum | 107.1 |
| Decile 9 | 32.7217 |
| Decile 8 | 28.5982 |
| Decile 7 | 25.8099 |
| Decile 6 | 23.4809 |
| Median | 21.387 |
| Decile 4 | 19.3277 |
| Decile 3 | 17.1155 |
| Decile 2 | 14.6249 |
| Decile 1 | 11.427 |
| Minimum | 0.124916 |
|

|
- Mean = 21.879
- Std.dev = 8.2845
- 60 items above graph maximum of 54.0165
|
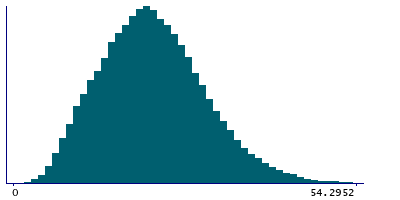
2 Instances
Instance 2 : Imaging visit (2014+)
83,241 participants, 83,241 items
| Maximum | 107.1 |
| Decile 9 | 32.6935 |
| Decile 8 | 28.5806 |
| Decile 7 | 25.791 |
| Decile 6 | 23.4647 |
| Median | 21.3735 |
| Decile 4 | 19.3063 |
| Decile 3 | 17.0899 |
| Decile 2 | 14.5929 |
| Decile 1 | 11.4006 |
| Minimum | 0.155312 |
|
|
- Mean = 21.8574
- Std.dev = 8.29002
- 57 items above graph maximum of 53.9864
|
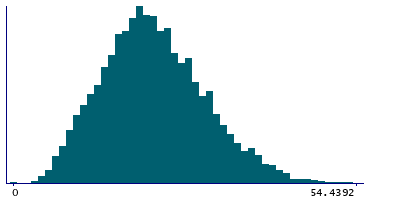
Instance 3 : First repeat imaging visit (2019+)
4,755 participants, 4,755 items
| Maximum | 56.3618 |
| Decile 9 | 33.1732 |
| Decile 8 | 28.9981 |
| Decile 7 | 26.1103 |
| Decile 6 | 23.7693 |
| Median | 21.6762 |
| Decile 4 | 19.6565 |
| Decile 3 | 17.593 |
| Decile 2 | 15.2194 |
| Decile 1 | 11.9073 |
| Minimum | 0.124916 |
|
|
- Mean = 22.2585
- Std.dev = 8.17802
- 3 items above graph maximum of 54.4392
|
Notes
Volume of LD in the right hemisphere generated by subcortical volumetric sub-segmentation of the Thalamic Nuclei
0 Related Data-Fields
There are no related data-fields
0 Resources
There are no matching Resources
