Data
87,996 items of data are available, covering 83,313 participants.
Defined-instances run from 2 to 3, labelled using Instancing
2.
Units of measurement are AU.
| Maximum | 39.6255 |
| Decile 9 | 32.1889 |
| Decile 8 | 31.3365 |
| Decile 7 | 30.7191 |
| Decile 6 | 30.1738 |
| Median | 29.6544 |
| Decile 4 | 29.1162 |
| Decile 3 | 28.51 |
| Decile 2 | 27.7662 |
| Decile 1 | 26.6715 |
| Minimum | 16.1673 |
|
|
- Mean = 29.5202
- Std.dev = 2.19445
- 76 items below graph minimum of 21.1542
- 2 items above graph maximum of 37.7062
|
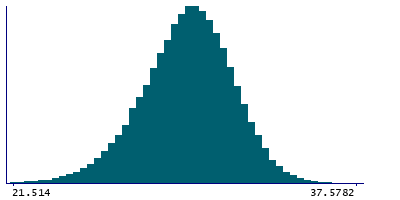
2 Instances
Instance 2 : Imaging visit (2014+)
83,241 participants, 83,241 items
| Maximum | 39.6255 |
| Decile 9 | 32.19 |
| Decile 8 | 31.3354 |
| Decile 7 | 30.7142 |
| Decile 6 | 30.1662 |
| Median | 29.6454 |
| Decile 4 | 29.1062 |
| Decile 3 | 28.493 |
| Decile 2 | 27.748 |
| Decile 1 | 26.6512 |
| Minimum | 16.1673 |
|

|
- Mean = 29.5098
- Std.dev = 2.20084
- 68 items below graph minimum of 21.1123
- 2 items above graph maximum of 37.7289
|
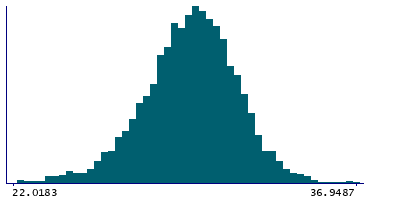
Instance 3 : First repeat imaging visit (2019+)
4,755 participants, 4,755 items
| Maximum | 36.9487 |
| Decile 9 | 32.1594 |
| Decile 8 | 31.375 |
| Decile 7 | 30.7984 |
| Decile 6 | 30.2893 |
| Median | 29.8239 |
| Decile 4 | 29.3196 |
| Decile 3 | 28.7946 |
| Decile 2 | 28.1286 |
| Decile 1 | 27.0889 |
| Minimum | 17.6794 |
|
|
- Mean = 29.7013
- Std.dev = 2.07105
- 7 items below graph minimum of 22.0183
|
Notes
Grey-white contrast in inferiorparietal in the left hemisphere calculated as a percentage of the mean gray-white matter intensity from Desikan-Killiany parcellation
0 Related Data-Fields
There are no related data-fields
0 Resources
There are no matching Resources
