Data
87,996 items of data are available, covering 83,313 participants.
Defined-instances run from 2 to 3, labelled using Instancing
2.
Units of measurement are AU.
| Maximum | 39.5279 |
| Decile 9 | 32.3145 |
| Decile 8 | 31.444 |
| Decile 7 | 30.7964 |
| Decile 6 | 30.2126 |
| Median | 29.644 |
| Decile 4 | 29.058 |
| Decile 3 | 28.3909 |
| Decile 2 | 27.5628 |
| Decile 1 | 26.3167 |
| Minimum | 16.4776 |
|

|
- Mean = 29.4528
- Std.dev = 2.38755
- 101 items below graph minimum of 20.319
- 3 items above graph maximum of 38.3123
|
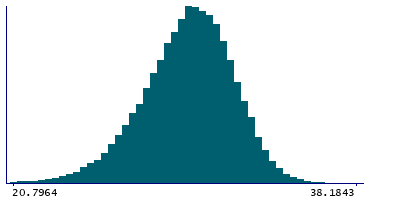
2 Instances
Instance 2 : Imaging visit (2014+)
83,241 participants, 83,241 items
| Maximum | 39.5279 |
| Decile 9 | 32.298 |
| Decile 8 | 31.4234 |
| Decile 7 | 30.7758 |
| Decile 6 | 30.1881 |
| Median | 29.6187 |
| Decile 4 | 29.0276 |
| Decile 3 | 28.3593 |
| Decile 2 | 27.5264 |
| Decile 1 | 26.2813 |
| Minimum | 16.4776 |
|
|
- Mean = 29.4264
- Std.dev = 2.39353
- 95 items below graph minimum of 20.2646
- 3 items above graph maximum of 38.3147
|
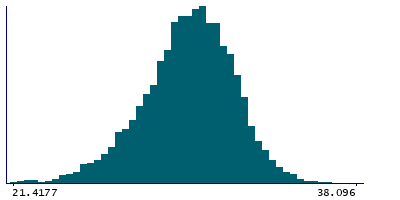
Instance 3 : First repeat imaging visit (2019+)
4,755 participants, 4,755 items
| Maximum | 38.236 |
| Decile 9 | 32.5366 |
| Decile 8 | 31.7677 |
| Decile 7 | 31.1591 |
| Decile 6 | 30.595 |
| Median | 30.0816 |
| Decile 4 | 29.5305 |
| Decile 3 | 28.9582 |
| Decile 2 | 28.1815 |
| Decile 1 | 26.9772 |
| Minimum | 16.7621 |
|
|
- Mean = 29.9146
- Std.dev = 2.23031
- 6 items below graph minimum of 21.4177
- 2 items above graph maximum of 38.096
|
Notes
Grey-white contrast in middletemporal in the right hemisphere calculated as a percentage of the mean gray-white matter intensity from Desikan-Killiany parcellation
0 Related Data-Fields
There are no related data-fields
0 Resources
There are no matching Resources
