Data
87,996 items of data are available, covering 83,313 participants.
Defined-instances run from 2 to 3, labelled using Instancing
2.
Units of measurement are AU.
| Maximum | 36.0767 |
| Decile 9 | 30.501 |
| Decile 8 | 29.6855 |
| Decile 7 | 29.068 |
| Decile 6 | 28.5276 |
| Median | 28.0107 |
| Decile 4 | 27.4757 |
| Decile 3 | 26.8845 |
| Decile 2 | 26.1587 |
| Decile 1 | 25.117 |
| Minimum | 12.136 |
|
|
- Mean = 27.8928
- Std.dev = 2.12752
- 50 items below graph minimum of 19.733
- 2 items above graph maximum of 35.885
|
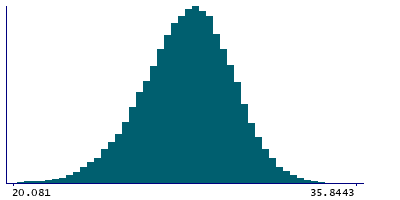
2 Instances
Instance 2 : Imaging visit (2014+)
83,241 participants, 83,241 items
| Maximum | 36.0767 |
| Decile 9 | 30.505 |
| Decile 8 | 29.6799 |
| Decile 7 | 29.0568 |
| Decile 6 | 28.516 |
| Median | 27.9926 |
| Decile 4 | 27.4582 |
| Decile 3 | 26.8669 |
| Decile 2 | 26.1356 |
| Decile 1 | 25.0948 |
| Minimum | 12.136 |
|

|
- Mean = 27.8797
- Std.dev = 2.13539
- 44 items below graph minimum of 19.6846
- 2 items above graph maximum of 35.9151
|
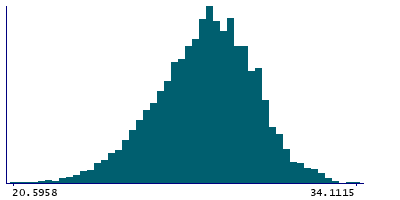
Instance 3 : First repeat imaging visit (2019+)
4,755 participants, 4,755 items
| Maximum | 34.1115 |
| Decile 9 | 30.4564 |
| Decile 8 | 29.7617 |
| Decile 7 | 29.2122 |
| Decile 6 | 28.7196 |
| Median | 28.2675 |
| Decile 4 | 27.7902 |
| Decile 3 | 27.2037 |
| Decile 2 | 26.521 |
| Decile 1 | 25.5261 |
| Minimum | 15.702 |
|
|
- Mean = 28.1216
- Std.dev = 1.97082
- 6 items below graph minimum of 20.5958
|
Notes
Grey-white contrast in parstriangularis in the right hemisphere calculated as a percentage of the mean gray-white matter intensity from Desikan-Killiany parcellation
0 Related Data-Fields
There are no related data-fields
0 Resources
There are no matching Resources
