Data
68,381 items of data are available, covering 63,696 participants.
Defined-instances run from 2 to 3, labelled using Instancing
2.
Units of measurement are AU.
| Maximum | 34.0581 |
| Decile 9 | 25.4231 |
| Decile 8 | 24.6204 |
| Decile 7 | 24.0554 |
| Decile 6 | 23.5805 |
| Median | 23.1262 |
| Decile 4 | 22.679 |
| Decile 3 | 22.1951 |
| Decile 2 | 21.6217 |
| Decile 1 | 20.8255 |
| Minimum | 14.0415 |
|
|
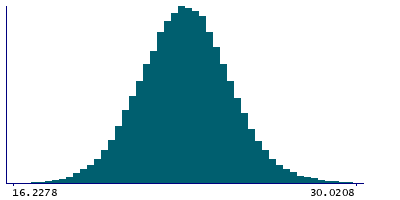
- Mean = 23.1347
- Std.dev = 1.82905
- 14 items below graph minimum of 16.2278
- 40 items above graph maximum of 30.0208
|
2 Instances
Instance 2 : Imaging visit (2014+)
63,624 participants, 63,624 items
| Maximum | 34.0581 |
| Decile 9 | 25.4455 |
| Decile 8 | 24.635 |
| Decile 7 | 24.0641 |
| Decile 6 | 23.5866 |
| Median | 23.1277 |
| Decile 4 | 22.6801 |
| Decile 3 | 22.1958 |
| Decile 2 | 21.6232 |
| Decile 1 | 20.8218 |
| Minimum | 14.0415 |
|

|
- Mean = 23.1411
- Std.dev = 1.83736
- 11 items below graph minimum of 16.1981
- 38 items above graph maximum of 30.0692
|
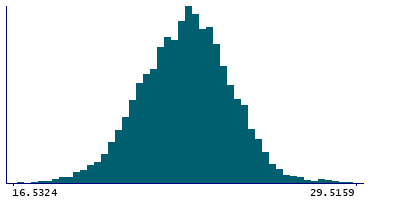
Instance 3 : First repeat imaging visit (2019+)
4,757 participants, 4,757 items
| Maximum | 29.6635 |
| Decile 9 | 25.1881 |
| Decile 8 | 24.4674 |
| Decile 7 | 23.9535 |
| Decile 6 | 23.5061 |
| Median | 23.0983 |
| Decile 4 | 22.6692 |
| Decile 3 | 22.1819 |
| Decile 2 | 21.5996 |
| Decile 1 | 20.8603 |
| Minimum | 14.7702 |
|
|
- Mean = 23.0489
- Std.dev = 1.71179
- 2 items below graph minimum of 16.5324
- 1 item above graph maximum of 29.5159
|
Notes
Grey-white contrast in postcentral in the right hemisphere calculated as a percentage of the mean gray-white matter intensity from Desikan-Killiany parcellation
0 Related Data-Fields
There are no related data-fields
0 Resources
There are no matching Resources
