Data
87,996 items of data are available, covering 83,313 participants.
Defined-instances run from 2 to 3, labelled using Instancing
2.
Units of measurement are mm.
| Maximum | 2.487 |
| Decile 9 | 1.869 |
| Decile 8 | 1.804 |
| Decile 7 | 1.758 |
| Decile 6 | 1.717 |
| Median | 1.679 |
| Decile 4 | 1.642 |
| Decile 3 | 1.602 |
| Decile 2 | 1.554 |
| Decile 1 | 1.488 |
| Minimum | 1.124 |
|
|
- Mean = 1.67943
- Std.dev = 0.148567
- 13 items above graph maximum of 2.25
|
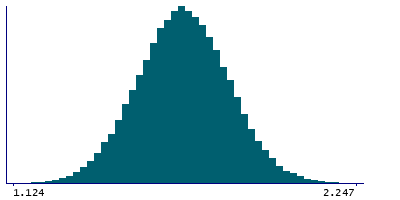
2 Instances
Instance 2 : Imaging visit (2014+)
83,241 participants, 83,241 items
| Maximum | 2.487 |
| Decile 9 | 1.869 |
| Decile 8 | 1.804 |
| Decile 7 | 1.758 |
| Decile 6 | 1.717 |
| Median | 1.679 |
| Decile 4 | 1.642 |
| Decile 3 | 1.602 |
| Decile 2 | 1.554 |
| Decile 1 | 1.488 |
| Minimum | 1.124 |
|

|
- Mean = 1.67919
- Std.dev = 0.14863
- 13 items above graph maximum of 2.25
|
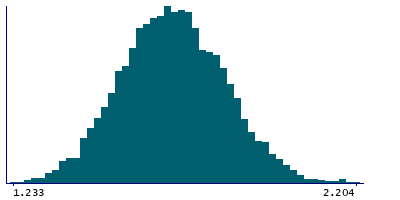
Instance 3 : First repeat imaging visit (2019+)
4,755 participants, 4,755 items
| Maximum | 2.204 |
| Decile 9 | 1.8725 |
| Decile 8 | 1.81 |
| Decile 7 | 1.76 |
| Decile 6 | 1.72 |
| Median | 1.6815 |
| Decile 4 | 1.644 |
| Decile 3 | 1.603 |
| Decile 2 | 1.559 |
| Decile 1 | 1.4955 |
| Minimum | 1.233 |
|
|
- Mean = 1.68375
- Std.dev = 0.147389
|
Notes
Mean thickness of V1 in the right hemisphere generated by parcellation of the white surface using BA_exvivo parcellation
0 Related Data-Fields
There are no related data-fields
0 Resources
There are no matching Resources
