Data
51,610 items of data are available, covering 46,924 participants.
Defined-instances run from 2 to 3, labelled using Instancing
2.
Units of measurement are mm.
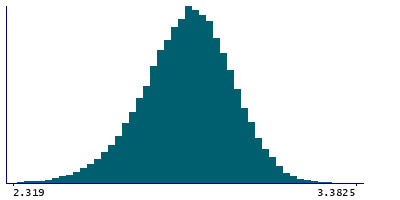
| Maximum | 3.355 |
| Decile 9 | 3.033 |
| Decile 8 | 2.978 |
| Decile 7 | 2.937 |
| Decile 6 | 2.902 |
| Median | 2.868 |
| Decile 4 | 2.833 |
| Decile 3 | 2.795 |
| Decile 2 | 2.748 |
| Decile 1 | 2.678 |
| Minimum | 1.792 |
|
|
- Mean = 2.86037
- Std.dev = 0.140982
- 48 items below graph minimum of 2.323
|
2 Instances
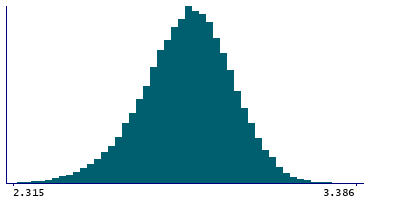
Instance 2 : Imaging visit (2014+)
46,852 participants, 46,852 items
| Maximum | 3.355 |
| Decile 9 | 3.034 |
| Decile 8 | 2.978 |
| Decile 7 | 2.937 |
| Decile 6 | 2.902 |
| Median | 2.868 |
| Decile 4 | 2.833 |
| Decile 3 | 2.794 |
| Decile 2 | 2.748 |
| Decile 1 | 2.677 |
| Minimum | 1.792 |
|
|
- Mean = 2.86033
- Std.dev = 0.141664
- 45 items below graph minimum of 2.32
|
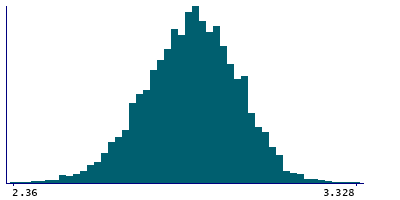
Instance 3 : First repeat imaging visit (2019+)
4,758 participants, 4,758 items
| Maximum | 3.328 |
| Decile 9 | 3.024 |
| Decile 8 | 2.973 |
| Decile 7 | 2.933 |
| Decile 6 | 2.898 |
| Median | 2.866 |
| Decile 4 | 2.833 |
| Decile 3 | 2.796 |
| Decile 2 | 2.751 |
| Decile 1 | 2.692 |
| Minimum | 1.874 |
|
|
- Mean = 2.86072
- Std.dev = 0.134083
- 4 items below graph minimum of 2.36
|
Notes
Mean thickness of fusiform in the left hemisphere generated by parcellation of the white surface using DKT parcellation
0 Related Data-Fields
There are no related data-fields
0 Resources
There are no matching Resources
