Data
51,610 items of data are available, covering 46,924 participants.
Defined-instances run from 2 to 3, labelled using Instancing
2.
Units of measurement are mm.
| Maximum | 3.437 |
| Decile 9 | 2.919 |
| Decile 8 | 2.843 |
| Decile 7 | 2.786 |
| Decile 6 | 2.735 |
| Median | 2.685 |
| Decile 4 | 2.634 |
| Decile 3 | 2.575 |
| Decile 2 | 2.504 |
| Decile 1 | 2.402 |
| Minimum | 1.596 |
|

|
- Mean = 2.67064
- Std.dev = 0.204371
- 36 items below graph minimum of 1.885
- 1 item above graph maximum of 3.436
|
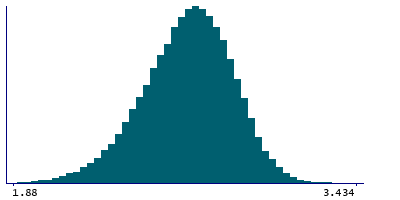
2 Instances
Instance 2 : Imaging visit (2014+)
46,852 participants, 46,852 items
| Maximum | 3.437 |
| Decile 9 | 2.919 |
| Decile 8 | 2.843 |
| Decile 7 | 2.786 |
| Decile 6 | 2.735 |
| Median | 2.685 |
| Decile 4 | 2.633 |
| Decile 3 | 2.575 |
| Decile 2 | 2.503 |
| Decile 1 | 2.401 |
| Minimum | 1.596 |
|
|
- Mean = 2.67047
- Std.dev = 0.204623
- 32 items below graph minimum of 1.883
|
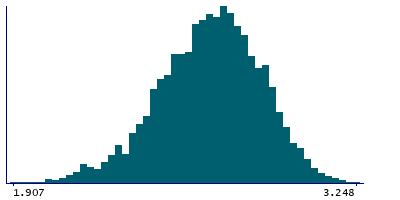
Instance 3 : First repeat imaging visit (2019+)
4,758 participants, 4,758 items
| Maximum | 3.248 |
| Decile 9 | 2.919 |
| Decile 8 | 2.845 |
| Decile 7 | 2.785 |
| Decile 6 | 2.735 |
| Median | 2.685 |
| Decile 4 | 2.635 |
| Decile 3 | 2.576 |
| Decile 2 | 2.507 |
| Decile 1 | 2.413 |
| Minimum | 1.697 |
|
|
- Mean = 2.67238
- Std.dev = 0.201865
- 3 items below graph minimum of 1.907
|
Notes
Mean thickness of paracentral in the left hemisphere generated by parcellation of the white surface using DKT parcellation
0 Related Data-Fields
There are no related data-fields
0 Resources
There are no matching Resources
