Data
51,610 items of data are available, covering 46,924 participants.
Defined-instances run from 2 to 3, labelled using Instancing
2.
Units of measurement are mm.
| Maximum | 3.061 |
| Decile 9 | 2.507 |
| Decile 8 | 2.447 |
| Decile 7 | 2.404 |
| Decile 6 | 2.366 |
| Median | 2.332 |
| Decile 4 | 2.294 |
| Decile 3 | 2.253 |
| Decile 2 | 2.202 |
| Decile 1 | 2.128 |
| Minimum | 1.573 |
|
|
- Mean = 2.32302
- Std.dev = 0.149724
- 13 items below graph minimum of 1.749
- 5 items above graph maximum of 2.886
|
2 Instances
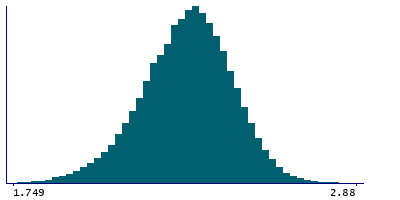
Instance 2 : Imaging visit (2014+)
46,852 participants, 46,852 items
| Maximum | 3.061 |
| Decile 9 | 2.506 |
| Decile 8 | 2.447 |
| Decile 7 | 2.403 |
| Decile 6 | 2.366 |
| Median | 2.331 |
| Decile 4 | 2.294 |
| Decile 3 | 2.252 |
| Decile 2 | 2.202 |
| Decile 1 | 2.127 |
| Minimum | 1.67 |
|

|
- Mean = 2.32232
- Std.dev = 0.150045
- 12 items below graph minimum of 1.748
- 5 items above graph maximum of 2.885
|
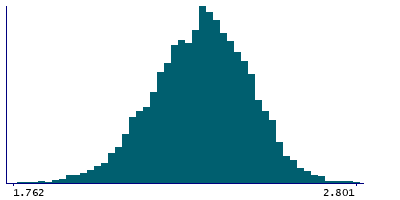
Instance 3 : First repeat imaging visit (2019+)
4,758 participants, 4,758 items
| Maximum | 2.801 |
| Decile 9 | 2.512 |
| Decile 8 | 2.455 |
| Decile 7 | 2.41 |
| Decile 6 | 2.372 |
| Median | 2.337 |
| Decile 4 | 2.299 |
| Decile 3 | 2.256 |
| Decile 2 | 2.21 |
| Decile 1 | 2.137 |
| Minimum | 1.573 |
|
|
- Mean = 2.32986
- Std.dev = 0.146345
- 1 item below graph minimum of 1.762
|
Notes
Mean thickness of postcentral in the left hemisphere generated by parcellation of the white surface using DKT parcellation
0 Related Data-Fields
There are no related data-fields
0 Resources
There are no matching Resources
