Data
51,610 items of data are available, covering 46,924 participants.
Defined-instances run from 2 to 3, labelled using Instancing
2.
Units of measurement are mm.
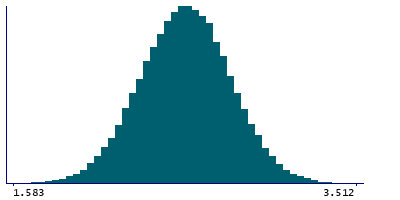
| Maximum | 3.689 |
| Decile 9 | 2.869 |
| Decile 8 | 2.758 |
| Decile 7 | 2.68 |
| Decile 6 | 2.613 |
| Median | 2.548 |
| Decile 4 | 2.485 |
| Decile 3 | 2.416 |
| Decile 2 | 2.335 |
| Decile 1 | 2.223 |
| Minimum | 1.422 |
|
|
- Mean = 2.54711
- Std.dev = 0.251578
- 5 items below graph minimum of 1.577
- 4 items above graph maximum of 3.515
|
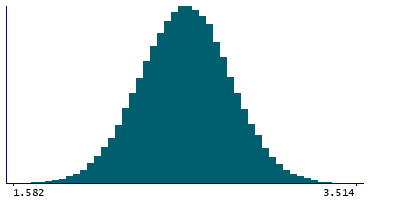
2 Instances
Instance 2 : Imaging visit (2014+)
46,852 participants, 46,852 items
| Maximum | 3.689 |
| Decile 9 | 2.869 |
| Decile 8 | 2.758 |
| Decile 7 | 2.679 |
| Decile 6 | 2.612 |
| Median | 2.548 |
| Decile 4 | 2.484 |
| Decile 3 | 2.415 |
| Decile 2 | 2.334 |
| Decile 1 | 2.222 |
| Minimum | 1.422 |
|
|
- Mean = 2.54656
- Std.dev = 0.252004
- 5 items below graph minimum of 1.575
- 3 items above graph maximum of 3.516
|
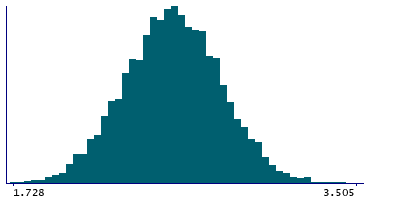
Instance 3 : First repeat imaging visit (2019+)
4,758 participants, 4,758 items
| Maximum | 3.519 |
| Decile 9 | 2.868 |
| Decile 8 | 2.761 |
| Decile 7 | 2.685 |
| Decile 6 | 2.616 |
| Median | 2.553 |
| Decile 4 | 2.492 |
| Decile 3 | 2.425 |
| Decile 2 | 2.342 |
| Decile 1 | 2.231 |
| Minimum | 1.728 |
|
|
- Mean = 2.55259
- Std.dev = 0.247284
- 1 item above graph maximum of 3.505
|
Notes
Mean thickness of transversetemporal in the left hemisphere generated by parcellation of the white surface using DKT parcellation
0 Related Data-Fields
There are no related data-fields
0 Resources
There are no matching Resources
