Data
502,877 items of data are available, covering 478,810 participants.
Defined-instances run from 0 to 2, labelled using Instancing
2.
Units of measurement are 10^9 cells/Litre.
| Maximum | 389.7 |
| Decile 9 | 9.12 |
| Decile 8 | 8.19 |
| Decile 7 | 7.57 |
| Decile 6 | 7.09 |
| Median | 6.65 |
| Decile 4 | 6.25 |
| Decile 3 | 5.85 |
| Decile 2 | 5.4 |
| Decile 1 | 4.83 |
| Minimum | 0 |
|

|
- Mean = 6.88125
- Std.dev = 2.13216
- 2246 items above graph maximum of 13.41
|
3 Instances
Instance 0 : Initial assessment visit (2006-2010) at which participants were recruited and consent given
477,633 participants, 477,633 items
| Maximum | 389.7 |
| Decile 9 | 9.14 |
| Decile 8 | 8.2 |
| Decile 7 | 7.58 |
| Decile 6 | 7.1 |
| Median | 6.65 |
| Decile 4 | 6.25 |
| Decile 3 | 5.85 |
| Decile 2 | 5.4 |
| Decile 1 | 4.83 |
| Minimum | 0 |
|

|
- Mean = 6.88516
- Std.dev = 2.12299
- 2094 items above graph maximum of 13.45
|
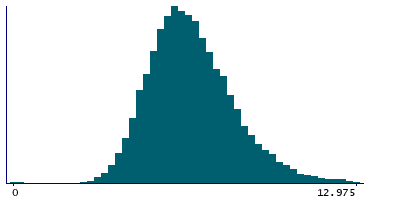
Instance 1 : First repeat assessment visit (2012-13)
19,389 participants, 19,389 items
| Maximum | 165.3 |
| Decile 9 | 8.9 |
| Decile 8 | 8 |
| Decile 7 | 7.4 |
| Decile 6 | 7 |
| Median | 6.6 |
| Decile 4 | 6.2 |
| Decile 3 | 5.8 |
| Decile 2 | 5.4 |
| Decile 1 | 4.82 |
| Minimum | 0 |
|
|
- Mean = 6.80608
- Std.dev = 2.38897
- 94 items above graph maximum of 12.98
|
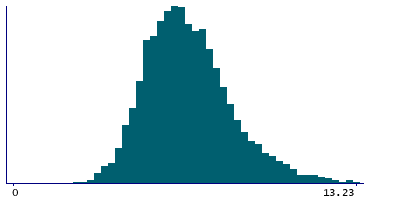
Instance 2 : Imaging visit (2014+)
5,855 participants, 5,855 items
| Maximum | 62.29 |
| Decile 9 | 9.03 |
| Decile 8 | 8.04 |
| Decile 7 | 7.47 |
| Decile 6 | 7.02 |
| Median | 6.57 |
| Decile 4 | 6.2 |
| Decile 3 | 5.79 |
| Decile 2 | 5.35 |
| Decile 1 | 4.83 |
| Minimum | 1.42 |
|
|
- Mean = 6.81126
- Std.dev = 1.96453
- 35 items above graph maximum of 13.23
|
Notes
Result of "White Blood Cell Count" assay, performed on blood sample, obtained from UK Biobank assessment centre visit. White blood count is the number of leukocytes.
Analyser operating range was 0 to 9x10^11 cells/Litre.
Typical reference range is 3.5x10^9 to 9.6x10^9 cells/Litre.

