Data
486,876 items of data are available, covering 470,285 participants.
Defined-instances run from 0 to 1, labelled using Instancing
2.
Units of measurement are mg/L.
| Maximum | 7.487 |
| Decile 9 | 1.088 |
| Decile 8 | 1.008 |
| Decile 7 | 0.959 |
| Decile 6 | 0.921 |
| Median | 0.886 |
| Decile 4 | 0.855 |
| Decile 3 | 0.822 |
| Decile 2 | 0.785 |
| Decile 1 | 0.738 |
| Minimum | 0.295 |
|

|
- Mean = 0.907948
- Std.dev = 0.176147
- 8 items below graph minimum of 0.388
- 4630 items above graph maximum of 1.438
|
2 Instances
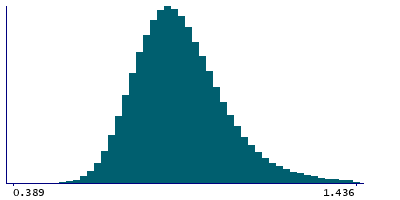
Instance 0 : Initial assessment visit (2006-2010) at which participants were recruited and consent given
469,031 participants, 469,031 items
| Maximum | 7.487 |
| Decile 9 | 1.087 |
| Decile 8 | 1.008 |
| Decile 7 | 0.959 |
| Decile 6 | 0.92 |
| Median | 0.886 |
| Decile 4 | 0.854 |
| Decile 3 | 0.822 |
| Decile 2 | 0.785 |
| Decile 1 | 0.738 |
| Minimum | 0.295 |
|
|
- Mean = 0.907565
- Std.dev = 0.176348
- 8 items below graph minimum of 0.389
- 4494 items above graph maximum of 1.436
|
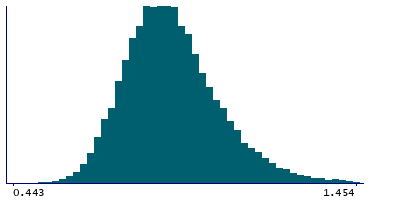
Instance 1 : First repeat assessment visit (2012-13)
17,845 participants, 17,845 items
| Maximum | 5.943 |
| Decile 9 | 1.101 |
| Decile 8 | 1.022 |
| Decile 7 | 0.97 |
| Decile 6 | 0.932 |
| Median | 0.899 |
| Decile 4 | 0.865 |
| Decile 3 | 0.832 |
| Decile 2 | 0.795 |
| Decile 1 | 0.747 |
| Minimum | 0.443 |
|
|
- Mean = 0.918018
- Std.dev = 0.17049
- 163 items above graph maximum of 1.455
|
Notes
Measured by latex enhanced immunoturbidimetric analysis on a Siemens ADVIA 1800
0 Related Data-Fields
There are no related data-fields

