Data
288,100 items of data are available, covering 236,375 participants.
Defined-instances run from 0 to 3, labelled using Instancing
2.
Units of measurement are deciseconds.
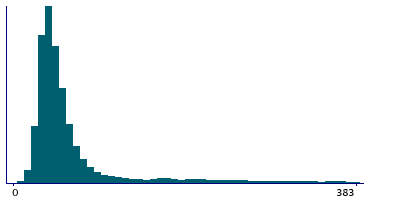
| Maximum | 89639 |
| Decile 9 | 307 |
| Decile 8 | 147 |
| Decile 7 | 81 |
| Decile 6 | 63 |
| Median | 54 |
| Decile 4 | 47 |
| Decile 3 | 41 |
| Decile 2 | 37 |
| Decile 1 | 31 |
| Minimum | 0 |
|
|
- There are 2225 distinct values.
- Mean = 129.723
- Std.dev = 287.23
- 11923 items above graph maximum of 583
|
4 Instances
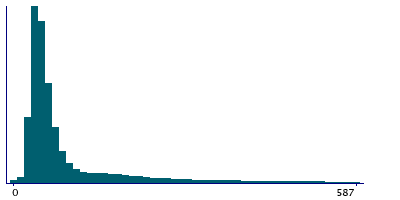
Instance 0 : Initial assessment visit (2006-2010) at which participants were recruited and consent given
171,426 participants, 171,426 items
| Maximum | 89639 |
| Decile 9 | 350 |
| Decile 8 | 172 |
| Decile 7 | 93 |
| Decile 6 | 68 |
| Median | 57 |
| Decile 4 | 49 |
| Decile 3 | 43 |
| Decile 2 | 38 |
| Decile 1 | 32 |
| Minimum | 0 |
|
|
- There are 2161 distinct values.
- Mean = 146.004
- Std.dev = 343.114
- 7132 items above graph maximum of 668
|
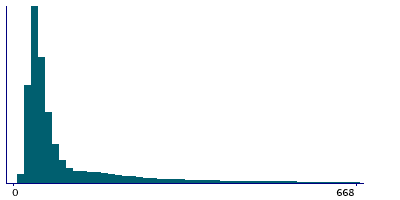
Instance 1 : First repeat assessment visit (2012-13)
20,323 participants, 20,323 items
| Maximum | 5442 |
| Decile 9 | 198 |
| Decile 8 | 91 |
| Decile 7 | 67 |
| Decile 6 | 57 |
| Median | 50 |
| Decile 4 | 44 |
| Decile 3 | 40 |
| Decile 2 | 35 |
| Decile 1 | 30 |
| Minimum | 0 |
|
|
- There are 927 distinct values.
- Mean = 100.557
- Std.dev = 181.839
- 1032 items above graph maximum of 366
|
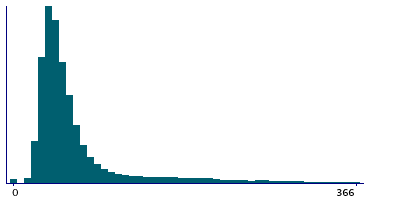
Instance 2 : Imaging visit (2014+)
84,193 participants, 84,193 items
| Maximum | 6657 |
| Decile 9 | 265 |
| Decile 8 | 115 |
| Decile 7 | 71 |
| Decile 6 | 58 |
| Median | 50 |
| Decile 4 | 45 |
| Decile 3 | 40 |
| Decile 2 | 36 |
| Decile 1 | 30 |
| Minimum | 0 |
|
|
- There are 1352 distinct values.
- Mean = 109.173
- Std.dev = 173.669
- 3189 items above graph maximum of 500
|
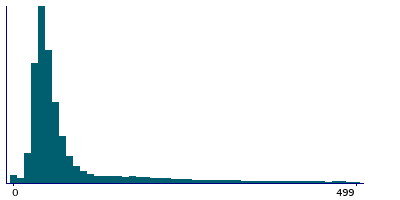
Instance 3 : First repeat imaging visit (2019+)
12,158 participants, 12,158 items
| Maximum | 4587 |
| Decile 9 | 210 |
| Decile 8 | 81 |
| Decile 7 | 61 |
| Decile 6 | 52 |
| Median | 45 |
| Decile 4 | 41 |
| Decile 3 | 37 |
| Decile 2 | 33 |
| Decile 1 | 29 |
| Minimum | 8 |
|
|
- There are 708 distinct values.
- Mean = 91.2328
- Std.dev = 146.105
- 537 items above graph maximum of 391
|


