Data
288,099 items of data are available, covering 236,375 participants.
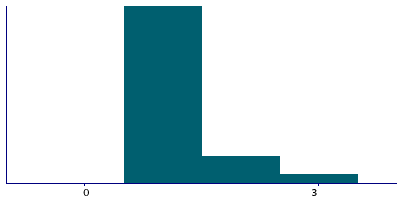
Defined-instances run from 0 to 3, labelled using Instancing
2.
| Maximum | 98 |
| Decile 9 | 2 |
| Decile 8 | 2 |
| Decile 7 | 1 |
| Decile 6 | 1 |
| Median | 1 |
| Decile 4 | 1 |
| Decile 3 | 1 |
| Decile 2 | 1 |
| Decile 1 | 1 |
| Minimum | 0 |
|
|
- There are 58 distinct values.
- Mean = 1.41828
- Std.dev = 1.30631
- 13995 items above graph maximum of 3
|
4 Instances
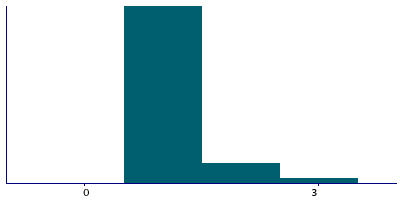
Instance 0 : Initial assessment visit (2006-2010) at which participants were recruited and consent given
171,426 participants, 171,426 items
| Maximum | 95 |
| Decile 9 | 2 |
| Decile 8 | 2 |
| Decile 7 | 1 |
| Decile 6 | 1 |
| Median | 1 |
| Decile 4 | 1 |
| Decile 3 | 1 |
| Decile 2 | 1 |
| Decile 1 | 1 |
| Minimum | 0 |
|

|
- There are 52 distinct values.
- Mean = 1.46901
- Std.dev = 1.40911
- 9198 items above graph maximum of 3
|
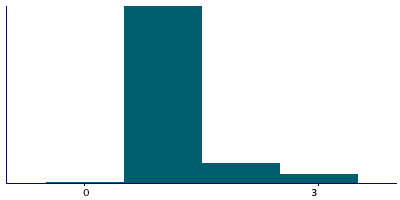
Instance 1 : First repeat assessment visit (2012-13)
20,322 participants, 20,322 items
| Maximum | 71 |
| Decile 9 | 2 |
| Decile 8 | 1 |
| Decile 7 | 1 |
| Decile 6 | 1 |
| Median | 1 |
| Decile 4 | 1 |
| Decile 3 | 1 |
| Decile 2 | 1 |
| Decile 1 | 1 |
| Minimum | 0 |
|
|
- There are 25 distinct values.
- Mean = 1.27714
- Std.dev = 1.11668
- 584 items above graph maximum of 3
|
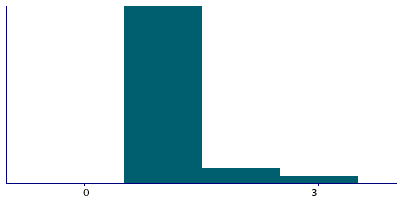
Instance 2 : Imaging visit (2014+)
84,193 participants, 84,193 items
| Maximum | 98 |
| Decile 9 | 2 |
| Decile 8 | 1 |
| Decile 7 | 1 |
| Decile 6 | 1 |
| Median | 1 |
| Decile 4 | 1 |
| Decile 3 | 1 |
| Decile 2 | 1 |
| Decile 1 | 1 |
| Minimum | 0 |
|
|
- There are 33 distinct values.
- Mean = 1.36794
- Std.dev = 1.16218
- 3779 items above graph maximum of 3
|
Instance 3 : First repeat imaging visit (2019+)
12,158 participants, 12,158 items
| Maximum | 25 |
| Decile 9 | 2 |
| Decile 8 | 1 |
| Decile 7 | 1 |
| Decile 6 | 1 |
| Median | 1 |
| Decile 4 | 1 |
| Decile 3 | 1 |
| Decile 2 | 1 |
| Decile 1 | 1 |
| Minimum | 0 |
|
|
- There are 19 distinct values.
- Mean = 1.28755
- Std.dev = 0.947839
- 434 items above graph maximum of 3
|


