Data
139,861 items of data are available, covering 122,250 participants.
Some values have special meanings defined by Data-Coding
100291.
Defined-instances run from 0 to 3, labelled using Instancing
2.
Units of measurement are weeks.
| Maximum | 999 |
| Decile 9 | 40 |
| Decile 8 | 20 |
| Decile 7 | 12 |
| Decile 6 | 8 |
| Median | 5 |
| Decile 4 | 4 |
| Decile 3 | 3 |
| Decile 2 | 2 |
| Decile 1 | 1 |
| Minimum | 1 |
|
|
- There are 201 distinct values.
- Mean = 16.0197
- Std.dev = 40.5086
- 3699 items above graph maximum of 79
- 2100 items have value -3 (Prefer not to answer)
- 25255 items have value -1 (Do not know)
|
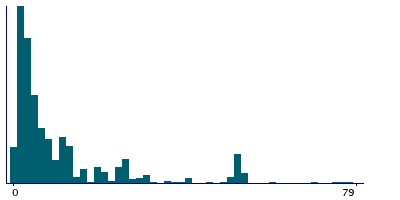
4 Instances
Instance 0 : Initial assessment visit (2006-2010) at which participants were recruited and consent given
89,344 participants, 89,344 items
| Maximum | 999 |
| Decile 9 | 40 |
| Decile 8 | 20 |
| Decile 7 | 12 |
| Decile 6 | 8 |
| Median | 5 |
| Decile 4 | 4 |
| Decile 3 | 3 |
| Decile 2 | 2 |
| Decile 1 | 1 |
| Minimum | 1 |
|
|
- There are 185 distinct values.
- Mean = 15.9319
- Std.dev = 41.6426
- 2347 items above graph maximum of 79
- 1433 items have value -3 (Prefer not to answer)
- 16165 items have value -1 (Do not know)
|
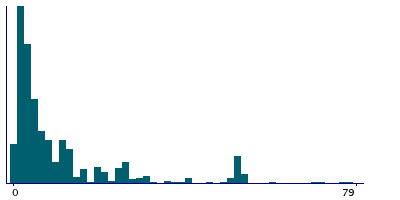
Instance 1 : First repeat assessment visit (2012-13)
10,106 participants, 10,106 items
| Maximum | 999 |
| Decile 9 | 40 |
| Decile 8 | 20 |
| Decile 7 | 12 |
| Decile 6 | 8 |
| Median | 6 |
| Decile 4 | 4 |
| Decile 3 | 3 |
| Decile 2 | 2 |
| Decile 1 | 1 |
| Minimum | 1 |
|
|
- There are 95 distinct values.
- Mean = 15.8094
- Std.dev = 37.3408
- 280 items above graph maximum of 79
- 116 items have value -3 (Prefer not to answer)
- 1861 items have value -1 (Do not know)
|
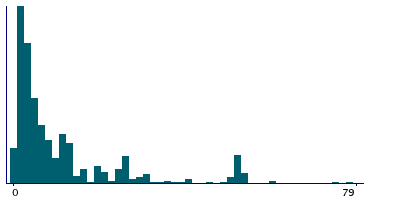
Instance 2 : Imaging visit (2014+)
37,003 participants, 37,003 items
| Maximum | 999 |
| Decile 9 | 45 |
| Decile 8 | 20 |
| Decile 7 | 12 |
| Decile 6 | 8 |
| Median | 6 |
| Decile 4 | 4 |
| Decile 3 | 3 |
| Decile 2 | 2 |
| Decile 1 | 2 |
| Minimum | 1 |
|
|
- There are 115 distinct values.
- Mean = 16.298
- Std.dev = 38.7875
- 956 items above graph maximum of 88
- 510 items have value -3 (Prefer not to answer)
- 6641 items have value -1 (Do not know)
|
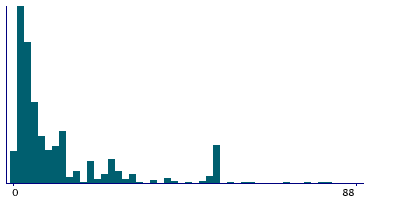
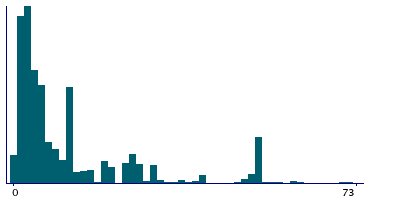
Instance 3 : First repeat imaging visit (2019+)
3,408 participants, 3,408 items
| Maximum | 900 |
| Decile 9 | 37.5 |
| Decile 8 | 20 |
| Decile 7 | 12 |
| Decile 6 | 8 |
| Median | 6 |
| Decile 4 | 4 |
| Decile 3 | 3 |
| Decile 2 | 2 |
| Decile 1 | 2 |
| Minimum | 1 |
|
|
- There are 59 distinct values.
- Mean = 15.9104
- Std.dev = 37.7125
- 84 items above graph maximum of 73
- 41 items have value -3 (Prefer not to answer)
- 588 items have value -1 (Do not know)
|
Notes
ACE touchscreen question "How many weeks was the longest period when you were feeling depressed or down?"
Question was introduced part way through fieldwork in April 2009.
The following checks were performed:
- If answer < 1 then rejected
- If answer > 999 then rejected
Field 4609 was collected from participants who indicated they have felt depressed or down for at least a whole week, as defined by their answers to Field 4598
Coding 100291 defines 2 special values:
- -1 represents "Do not know"
- -3 represents "Prefer not to answer"
1 Related Data-Field
| Field ID | Description | Relationship |
|---|
| 4598 | Ever depressed for a whole week | Current Field was collected from participants who indicated they have felt depressed or down for at least a whole week, as defined by their answers to Field 4598 |


