Data
24,767 items of data are available, covering 19,475 participants.
Defined-instances run from 2 to 3, labelled using Instancing
2.
Array indices run from 0 to 23.
Units of measurement are error-count.
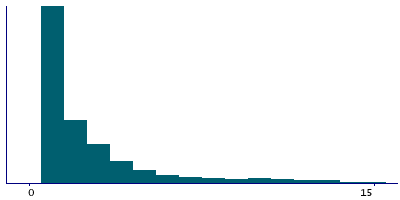
| Maximum | 46 |
| Decile 9 | 8 |
| Decile 8 | 4 |
| Decile 7 | 3 |
| Decile 6 | 2 |
| Median | 2 |
| Decile 4 | 1 |
| Decile 3 | 1 |
| Decile 2 | 1 |
| Decile 1 | 1 |
| Minimum | 1 |
|
|
- There are 37 distinct values.
- Mean = 3.2058
- Std.dev = 4.13274
- 747 items above graph maximum of 15
|
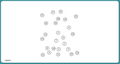
2 Instances
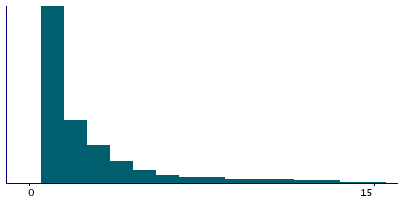
Instance 2 : Imaging visit (2014+)
18,016 participants, 22,202 items
| Maximum | 46 |
| Decile 9 | 8 |
| Decile 8 | 4 |
| Decile 7 | 3 |
| Decile 6 | 2 |
| Median | 2 |
| Decile 4 | 1 |
| Decile 3 | 1 |
| Decile 2 | 1 |
| Decile 1 | 1 |
| Minimum | 1 |
|
|
- There are 37 distinct values.
- Mean = 3.20025
- Std.dev = 4.141
- 672 items above graph maximum of 15
|
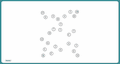
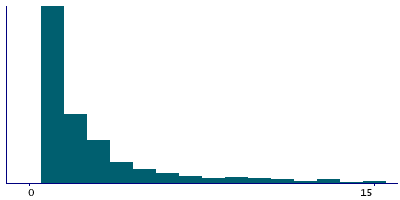
Instance 3 : First repeat imaging visit (2019+)
2,089 participants, 2,565 items
| Maximum | 32 |
| Decile 9 | 8 |
| Decile 8 | 4 |
| Decile 7 | 3 |
| Decile 6 | 2 |
| Median | 2 |
| Decile 4 | 1 |
| Decile 3 | 1 |
| Decile 2 | 1 |
| Decile 1 | 1 |
| Minimum | 1 |
|
|
- There are 27 distinct values.
- Mean = 3.2538
- Std.dev = 4.06016
- 75 items above graph maximum of 15
|
Notes
Errors before selecting a particular correct item in numeric path (trail #1). Only values greater than zero are recorded.
It is possible that the value recorded here is less than the sum of the values in Field 6349 since this field does not count mistakes made on the latest circle when the trail timed-out before it was correctly selected.