Data
643,195 items of data are available, covering 501,085 participants.
Some values have special meanings defined by Data-Coding
100373.
Defined-instances run from 0 to 3, labelled using Instancing
2.
Units of measurement are tablespoons/day.
| Maximum | 50 |
| Decile 9 | 5 |
| Decile 8 | 3 |
| Decile 7 | 3 |
| Decile 6 | 2 |
| Median | 2 |
| Decile 4 | 1 |
| Decile 3 | 1 |
| Decile 2 | 1 |
| Decile 1 | 1 |
| Minimum | 0 |
|

|
- There are 46 distinct values.
- Mean = 2.28253
- Std.dev = 2.16704
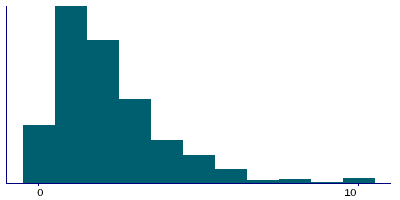
- 8309 items above graph maximum of 9
- 30451 items have value -10 (Less than one)
- 596 items have value -3 (Prefer not to answer)
- 7376 items have value -1 (Do not know)
|
4 Instances
Instance 0 : Initial assessment visit (2006-2010) at which participants were recruited and consent given
501,044 participants, 501,044 items
| Maximum | 50 |
| Decile 9 | 5 |
| Decile 8 | 3 |
| Decile 7 | 3 |
| Decile 6 | 2 |
| Median | 2 |
| Decile 4 | 1 |
| Decile 3 | 1 |
| Decile 2 | 1 |
| Decile 1 | 0 |
| Minimum | 0 |
|
|
- There are 45 distinct values.
- Mean = 2.27299
- Std.dev = 2.17531
- 2444 items above graph maximum of 10
- 23414 items have value -10 (Less than one)
- 539 items have value -3 (Prefer not to answer)
- 6411 items have value -1 (Do not know)
|
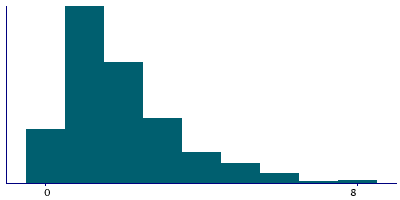
Instance 1 : First repeat assessment visit (2012-13)
20,314 participants, 20,314 items
| Maximum | 40 |
| Decile 9 | 4 |
| Decile 8 | 3 |
| Decile 7 | 2 |
| Decile 6 | 2 |
| Median | 2 |
| Decile 4 | 1 |
| Decile 3 | 1 |
| Decile 2 | 1 |
| Decile 1 | 0 |
| Minimum | 0 |
|
|
- There are 27 distinct values.
- Mean = 2.06903
- Std.dev = 1.95805
- 235 items above graph maximum of 8
- 1248 items have value -10 (Less than one)
- 8 items have value -3 (Prefer not to answer)
- 110 items have value -1 (Do not know)
|
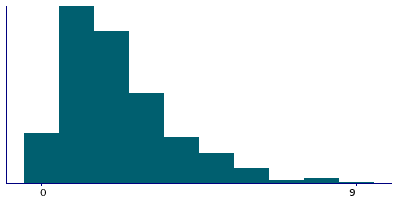
Instance 2 : Imaging visit (2014+)
100,917 participants, 100,917 items
| Maximum | 50 |
| Decile 9 | 5 |
| Decile 8 | 3 |
| Decile 7 | 3 |
| Decile 6 | 2 |
| Median | 2 |
| Decile 4 | 2 |
| Decile 3 | 1 |
| Decile 2 | 1 |
| Decile 1 | 1 |
| Minimum | 0 |
|
|
- There are 34 distinct values.
- Mean = 2.37759
- Std.dev = 2.20005
- 1316 items above graph maximum of 9
- 4678 items have value -10 (Less than one)
- 42 items have value -3 (Prefer not to answer)
- 714 items have value -1 (Do not know)
|
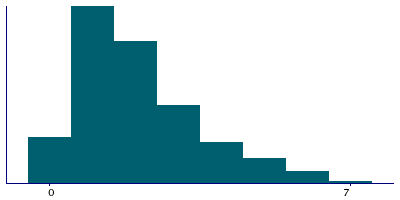
Instance 3 : First repeat imaging visit (2019+)
20,920 participants, 20,920 items
| Maximum | 30 |
| Decile 9 | 4 |
| Decile 8 | 3 |
| Decile 7 | 3 |
| Decile 6 | 2 |
| Median | 2 |
| Decile 4 | 1 |
| Decile 3 | 1 |
| Decile 2 | 1 |
| Decile 1 | 1 |
| Minimum | 0 |
|
|
- There are 20 distinct values.
- Mean = 2.25482
- Std.dev = 1.96885
- 409 items above graph maximum of 7
- 1111 items have value -10 (Less than one)
- 7 items have value -3 (Prefer not to answer)
- 141 items have value -1 (Do not know)
|
Notes
ACE touchscreen question "On average how many heaped tablespoons of SALAD or RAW vegetables would you eat per DAY? (Include lettuce, tomato in sandwiches; put '0' if you do not eat any)"
The following checks were performed:
- If answer > 50 then rejected
If the participant activated the Help button they were shown the message:
Please provide an average considering your intake over the last year.
If you are unsure, please provide an estimate or select Do not know.
If you have less than one tablespoon a day select Less than one.
|
Coding 100373 defines 3 special values:
- -10 represents "Less than one"
- -1 represents "Do not know"
- -3 represents "Prefer not to answer"
0 Related Data-Fields
There are no related data-fields


