Data
120,830 items of data are available, covering 100,555 participants.
Defined-instances run from 2 to 3, labelled using Instancing
2.
Units of measurement are seconds.
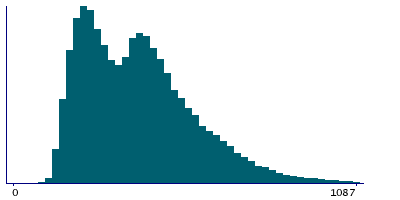
| Maximum | 4665 |
| Decile 9 | 603 |
| Decile 8 | 494 |
| Decile 7 | 428 |
| Decile 6 | 375 |
| Median | 319 |
| Decile 4 | 273 |
| Decile 3 | 239 |
| Decile 2 | 211 |
| Decile 1 | 180 |
| Minimum | 28 |
|
|
- There are 1242 distinct values.
- Mean = 361.771
- Std.dev = 177.674
- 511 items above graph maximum of 1026
|
2 Instances
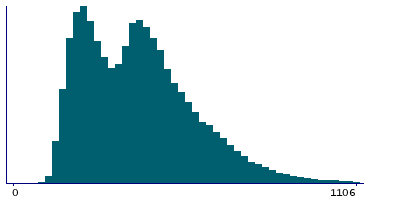
Instance 2 : Imaging visit (2014+)
100,004 participants, 100,004 items
| Maximum | 4665 |
| Decile 9 | 626 |
| Decile 8 | 519 |
| Decile 7 | 452 |
| Decile 6 | 401 |
| Median | 350 |
| Decile 4 | 294 |
| Decile 3 | 250 |
| Decile 2 | 218 |
| Decile 1 | 186 |
| Minimum | 28 |
|
|
- There are 1227 distinct values.
- Mean = 379.813
- Std.dev = 182.236
- 351 items above graph maximum of 1066
|
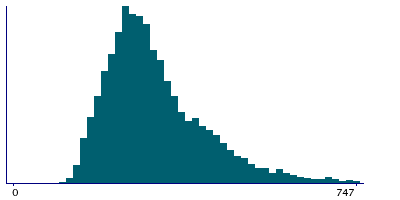
Instance 3 : First repeat imaging visit (2019+)
20,826 participants, 20,826 items
| Maximum | 1816 |
| Decile 9 | 416 |
| Decile 8 | 339 |
| Decile 7 | 299 |
| Decile 6 | 272 |
| Median | 249 |
| Decile 4 | 228 |
| Decile 3 | 207 |
| Decile 2 | 185 |
| Decile 1 | 162 |
| Minimum | 40 |
|
|
- There are 769 distinct values.
- Mean = 275.136
- Std.dev = 120.891
- 283 items above graph maximum of 670
|
Notes
Biometrics duration
0 Related Data-Fields
There are no related data-fields
0 Resources
There are no matching Resources
