Data
572,884 items of data are available, covering 492,818 participants.
Defined-instances run from 0 to 3, labelled using Instancing
2.
Units of measurement are Kg.
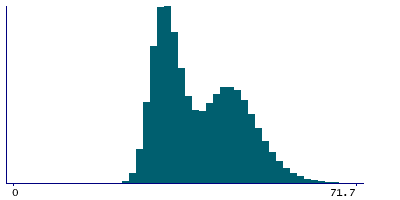
| Maximum | 84.3 |
| Decile 9 | 50.5 |
| Decile 8 | 46.9 |
| Decile 7 | 44 |
| Decile 6 | 40.9 |
| Median | 37 |
| Decile 4 | 34.3 |
| Decile 3 | 32.5 |
| Decile 2 | 31 |
| Decile 1 | 29.3 |
| Minimum | 18.9 |
|
|
- Mean = 38.8626
- Std.dev = 8.38012
- 101 items above graph maximum of 71.7
|
4 Instances
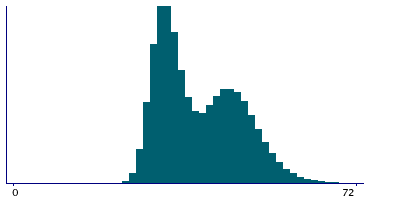
Instance 0 : Initial assessment visit (2006-2010) at which participants were recruited and consent given
492,025 participants, 492,025 items
| Maximum | 84.3 |
| Decile 9 | 50.7 |
| Decile 8 | 47.1 |
| Decile 7 | 44.1 |
| Decile 6 | 40.9 |
| Median | 37 |
| Decile 4 | 34.4 |
| Decile 3 | 32.6 |
| Decile 2 | 31.1 |
| Decile 1 | 29.4 |
| Minimum | 18.9 |
|
|
- Mean = 38.9484
- Std.dev = 8.4144
- 82 items above graph maximum of 72
|
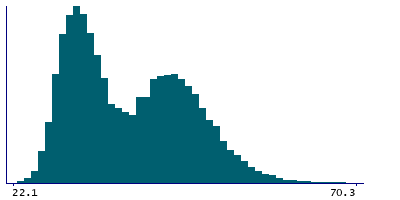
Instance 1 : First repeat assessment visit (2012-13)
20,036 participants, 20,036 items
| Maximum | 77 |
| Decile 9 | 49.6 |
| Decile 8 | 46.3 |
| Decile 7 | 43.6 |
| Decile 6 | 41 |
| Median | 37.3 |
| Decile 4 | 34.1 |
| Decile 3 | 32.2 |
| Decile 2 | 30.65 |
| Decile 1 | 28.9 |
| Minimum | 22.1 |
|
|
- Mean = 38.5117
- Std.dev = 8.14793
- 6 items above graph maximum of 70.3
|
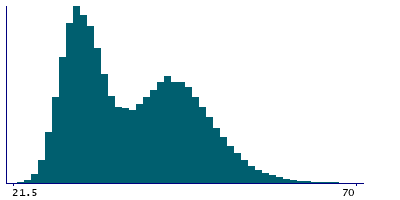
Instance 2 : Imaging visit (2014+)
55,655 participants, 55,655 items
| Maximum | 75.2 |
| Decile 9 | 49.4 |
| Decile 8 | 46 |
| Decile 7 | 43.3 |
| Decile 6 | 40.6 |
| Median | 37 |
| Decile 4 | 34 |
| Decile 3 | 32.1 |
| Decile 2 | 30.5 |
| Decile 1 | 28.8 |
| Minimum | 21.5 |
|
|
- Mean = 38.3
- Std.dev = 8.15207
- 13 items above graph maximum of 70
|
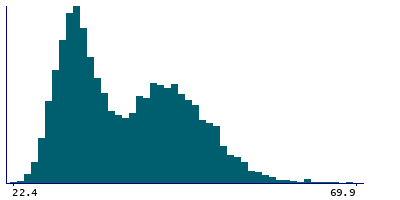
Instance 3 : First repeat imaging visit (2019+)
5,168 participants, 5,168 items
| Maximum | 74.4 |
| Decile 9 | 49.3 |
| Decile 8 | 45.8 |
| Decile 7 | 43.1 |
| Decile 6 | 40.4 |
| Median | 36.8 |
| Decile 4 | 33.8 |
| Decile 3 | 31.8 |
| Decile 2 | 30.4 |
| Decile 1 | 28.7 |
| Minimum | 22.4 |
|
|
- Mean = 38.1133
- Std.dev = 8.10942
- 1 item above graph maximum of 69.9
|
Notes
Body composition estimation by impedance measurement. Body water mass
Units in Kg. Increments in 0.1 Kg.


