Data
572,513 items of data are available, covering 492,526 participants.
Defined-instances run from 0 to 3, labelled using Instancing
2.
Units of measurement are Kg.
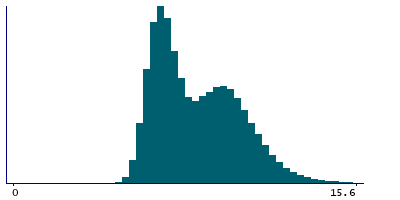
| Maximum | 22.9 |
| Decile 9 | 10.9 |
| Decile 8 | 10.1 |
| Decile 7 | 9.4 |
| Decile 6 | 8.7 |
| Median | 8 |
| Decile 4 | 7.4 |
| Decile 3 | 6.9 |
| Decile 2 | 6.6 |
| Decile 1 | 6.2 |
| Minimum | 2.2 |
|
|
- Mean = 8.34881
- Std.dev = 1.90262
- 693 items above graph maximum of 15.6
|
4 Instances
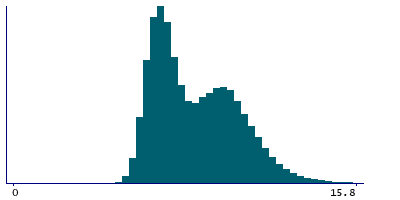
Instance 0 : Initial assessment visit (2006-2010) at which participants were recruited and consent given
491,719 participants, 491,719 items
| Maximum | 22.9 |
| Decile 9 | 11 |
| Decile 8 | 10.1 |
| Decile 7 | 9.5 |
| Decile 6 | 8.8 |
| Median | 8 |
| Decile 4 | 7.4 |
| Decile 3 | 7 |
| Decile 2 | 6.6 |
| Decile 1 | 6.2 |
| Minimum | 2.2 |
|
|
- Mean = 8.38985
- Std.dev = 1.91414
- 527 items above graph maximum of 15.8
|
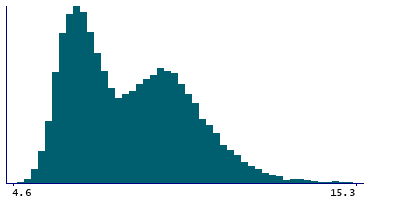
Instance 1 : First repeat assessment visit (2012-13)
20,022 participants, 20,022 items
| Maximum | 18.6 |
| Decile 9 | 10.7 |
| Decile 8 | 9.8 |
| Decile 7 | 9.3 |
| Decile 6 | 8.7 |
| Median | 8 |
| Decile 4 | 7.3 |
| Decile 3 | 6.9 |
| Decile 2 | 6.5 |
| Decile 1 | 6.1 |
| Minimum | 4.6 |
|
|
- Mean = 8.23393
- Std.dev = 1.81974
- 30 items above graph maximum of 15.3
|
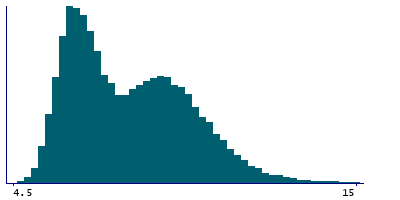
Instance 2 : Imaging visit (2014+)
55,607 participants, 55,607 items
| Maximum | 17.9 |
| Decile 9 | 10.5 |
| Decile 8 | 9.7 |
| Decile 7 | 9.1 |
| Decile 6 | 8.5 |
| Median | 7.8 |
| Decile 4 | 7.2 |
| Decile 3 | 6.7 |
| Decile 2 | 6.4 |
| Decile 1 | 6 |
| Minimum | 4.5 |
|
|
- Mean = 8.05965
- Std.dev = 1.80828
- 69 items above graph maximum of 15
|
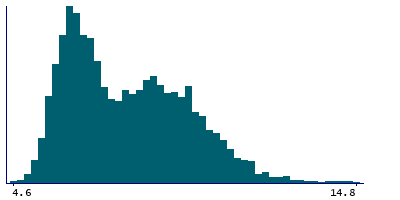
Instance 3 : First repeat imaging visit (2019+)
5,165 participants, 5,165 items
| Maximum | 16.6 |
| Decile 9 | 10.4 |
| Decile 8 | 9.6 |
| Decile 7 | 9 |
| Decile 6 | 8.4 |
| Median | 7.7 |
| Decile 4 | 7.1 |
| Decile 3 | 6.7 |
| Decile 2 | 6.3 |
| Decile 1 | 6 |
| Minimum | 4.6 |
|
|
- Mean = 8.00031
- Std.dev = 1.77832
- 5 items above graph maximum of 14.8
|


