Data
49,318 items of data are available, covering 45,972 participants.
Defined-instances run from 2 to 3, labelled using Instancing
2.
Units of measurement are Std.Devs.
| Maximum | 9.89616 |
| Decile 9 | 2.01772 |
| Decile 8 | 1.19959 |
| Decile 7 | 0.65456 |
| Decile 6 | 0.193736 |
| Median | -0.218245 |
| Decile 4 | -0.608757 |
| Decile 3 | -1.02103 |
| Decile 2 | -1.48479 |
| Decile 1 | -2.08297 |
| Minimum | -8.72349 |
|
|
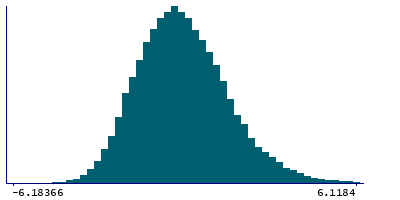
- Mean = -0.0957487
- Std.dev = 1.63928
- 4 items below graph minimum of -6.18366
- 73 items above graph maximum of 6.1184
|
2 Instances
Instance 2 : Imaging visit (2014+)
45,490 participants, 45,490 items
| Maximum | 9.89616 |
| Decile 9 | 2.03373 |
| Decile 8 | 1.21502 |
| Decile 7 | 0.670538 |
| Decile 6 | 0.205506 |
| Median | -0.206164 |
| Decile 4 | -0.601202 |
| Decile 3 | -1.01519 |
| Decile 2 | -1.48075 |
| Decile 1 | -2.07857 |
| Minimum | -8.72349 |
|

|
- Mean = -0.0854387
- Std.dev = 1.64488
- 4 items below graph minimum of -6.19087
- 67 items above graph maximum of 6.14603
|
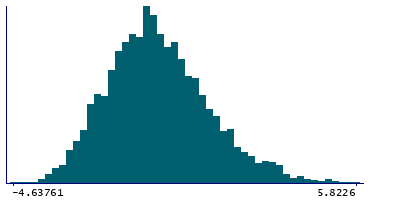
Instance 3 : First repeat imaging visit (2019+)
3,828 participants, 3,828 items
| Maximum | 6.76964 |
| Decile 9 | 1.84512 |
| Decile 8 | 1.01664 |
| Decile 7 | 0.466503 |
| Decile 6 | 0.0305708 |
| Median | -0.361394 |
| Decile 4 | -0.686732 |
| Decile 3 | -1.10237 |
| Decile 2 | -1.52927 |
| Decile 1 | -2.13236 |
| Minimum | -4.63761 |
|
|
- Mean = -0.218268
- Std.dev = 1.56593
- 6 items above graph maximum of 5.8226
|