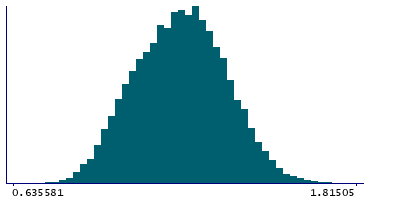
Data
27,256 items of data are available, covering 26,268 participants.
Defined-instances run from 2 to 3, labelled using Instancing
2.
Units of measurement are g/cm2.
| Maximum | 1.89717 |
| Decile 9 | 1.40992 |
| Decile 8 | 1.34397 |
| Decile 7 | 1.29498 |
| Decile 6 | 1.2535 |
| Median | 1.21119 |
| Decile 4 | 1.16992 |
| Decile 3 | 1.12425 |
| Decile 2 | 1.07078 |
| Decile 1 | 1.00478 |
| Minimum | 0.635581 |
|
|
- Mean = 1.20977
- Std.dev = 0.154915
- 4 items above graph maximum of 1.81505
|
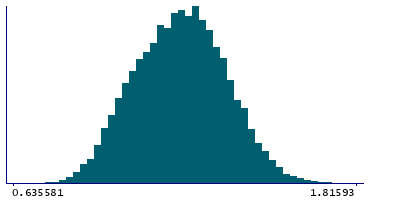
2 Instances
Instance 2 : Imaging visit (2014+)
25,272 participants, 25,272 items
| Maximum | 1.89717 |
| Decile 9 | 1.41024 |
| Decile 8 | 1.34426 |
| Decile 7 | 1.29545 |
| Decile 6 | 1.25397 |
| Median | 1.21146 |
| Decile 4 | 1.16967 |
| Decile 3 | 1.12422 |
| Decile 2 | 1.07057 |
| Decile 1 | 1.00455 |
| Minimum | 0.635581 |
|
|
- Mean = 1.20994
- Std.dev = 0.155247
- 4 items above graph maximum of 1.81593
|
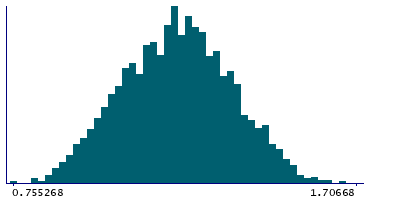
Instance 3 : First repeat imaging visit (2019+)
1,984 participants, 1,984 items
| Maximum | 1.70668 |
| Decile 9 | 1.40587 |
| Decile 8 | 1.33828 |
| Decile 7 | 1.28798 |
| Decile 6 | 1.24757 |
| Median | 1.2084 |
| Decile 4 | 1.17155 |
| Decile 3 | 1.1251 |
| Decile 2 | 1.07223 |
| Decile 1 | 1.00637 |
| Minimum | 0.755268 |
|
|
- Mean = 1.20768
- Std.dev = 0.150608
- 1 item above graph maximum of 1.70668
|