Data
27,256 items of data are available, covering 26,268 participants.
Defined-instances run from 2 to 3, labelled using Instancing
2.
Units of measurement are cm2.
| Maximum | 330.568 |
| Decile 9 | 235.53 |
| Decile 8 | 222.166 |
| Decile 7 | 211.731 |
| Decile 6 | 201.54 |
| Median | 190.682 |
| Decile 4 | 181.173 |
| Decile 3 | 172.692 |
| Decile 2 | 164.781 |
| Decile 1 | 155.517 |
| Minimum | 20.0176 |
|

|
- Mean = 193.688
- Std.dev = 31.0462
- 3 items above graph maximum of 315.544
|
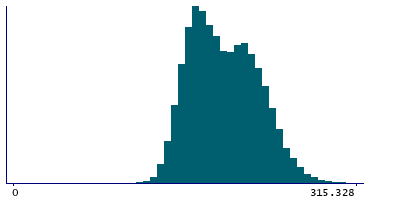
2 Instances
Instance 2 : Imaging visit (2014+)
25,272 participants, 25,272 items
| Maximum | 330.568 |
| Decile 9 | 235.319 |
| Decile 8 | 221.997 |
| Decile 7 | 211.569 |
| Decile 6 | 201.359 |
| Median | 190.508 |
| Decile 4 | 181.008 |
| Decile 3 | 172.523 |
| Decile 2 | 164.666 |
| Decile 1 | 155.31 |
| Minimum | 20.0176 |
|
|
- Mean = 193.503
- Std.dev = 31.0291
- 2 items above graph maximum of 315.328
|
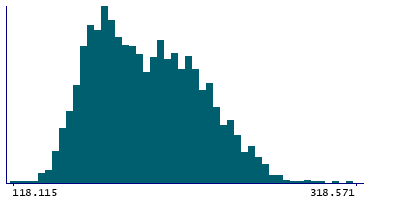
Instance 3 : First repeat imaging visit (2019+)
1,984 participants, 1,984 items
| Maximum | 323.672 |
| Decile 9 | 238.456 |
| Decile 8 | 224.464 |
| Decile 7 | 213.662 |
| Decile 6 | 203.894 |
| Median | 193.117 |
| Decile 4 | 183.511 |
| Decile 3 | 174.351 |
| Decile 2 | 166.808 |
| Decile 1 | 158.341 |
| Minimum | 118.115 |
|
|
- Mean = 196.047
- Std.dev = 31.1663
- 1 item above graph maximum of 318.571
|