Data
67,431 items of data are available, covering 62,785 participants.
Defined-instances run from 2 to 3, labelled using Instancing
2.
Units of measurement are mm3.
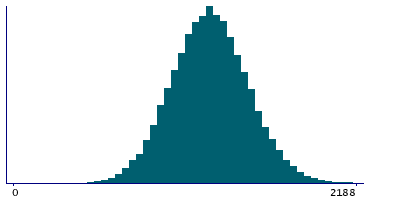
| Maximum | 4138 |
| Decile 9 | 1566 |
| Decile 8 | 1457 |
| Decile 7 | 1377 |
| Decile 6 | 1312 |
| Median | 1251 |
| Decile 4 | 1190 |
| Decile 3 | 1125 |
| Decile 2 | 1048 |
| Decile 1 | 944 |
| Minimum | 255 |
|
|
- Mean = 1254.72
- Std.dev = 247.516
- 86 items above graph maximum of 2188
|
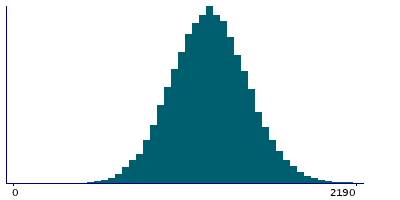
2 Instances
Instance 2 : Imaging visit (2014+)
62,648 participants, 62,648 items
| Maximum | 4138 |
| Decile 9 | 1567 |
| Decile 8 | 1457 |
| Decile 7 | 1378 |
| Decile 6 | 1313 |
| Median | 1252 |
| Decile 4 | 1190 |
| Decile 3 | 1125 |
| Decile 2 | 1048 |
| Decile 1 | 944 |
| Minimum | 255 |
|
|
- Mean = 1255.33
- Std.dev = 247.917
- 83 items above graph maximum of 2190
|
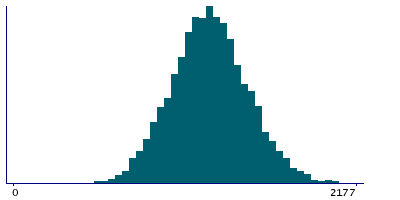
Instance 3 : First repeat imaging visit (2019+)
4,783 participants, 4,783 items
| Maximum | 2382 |
| Decile 9 | 1556 |
| Decile 8 | 1448 |
| Decile 7 | 1367 |
| Decile 6 | 1301 |
| Median | 1242 |
| Decile 4 | 1182 |
| Decile 3 | 1120 |
| Decile 2 | 1044.5 |
| Decile 1 | 935 |
| Minimum | 427 |
|
|
- Mean = 1246.8
- Std.dev = 242.065
- 3 items above graph maximum of 2177
|
Notes
Volume of left amygdala (from T1 brain image)
0 Related Data-Fields
There are no related data-fields
0 Resources
There are no matching Resources
