Data
64,947 items of data are available, covering 60,419 participants.
Defined-instances run from 2 to 3, labelled using Instancing
2.
Units of measurement are AU.
| Maximum | 0.698198 |
| Decile 9 | 0.6053 |
| Decile 8 | 0.592674 |
| Decile 7 | 0.583187 |
| Decile 6 | 0.575014 |
| Median | 0.567138 |
| Decile 4 | 0.559261 |
| Decile 3 | 0.55045 |
| Decile 2 | 0.539894 |
| Decile 1 | 0.524941 |
| Minimum | 0 |
|

|
- Mean = 0.565811
- Std.dev = 0.0323571
- 101 items below graph minimum of 0.444581
- 2 items above graph maximum of 0.685659
|
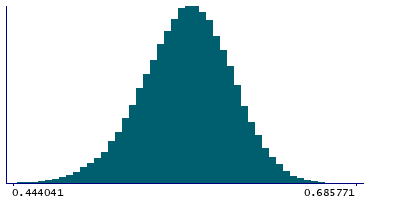
2 Instances
Instance 2 : Imaging visit (2014+)
60,187 participants, 60,187 items
| Maximum | 0.698198 |
| Decile 9 | 0.605195 |
| Decile 8 | 0.592557 |
| Decile 7 | 0.583 |
| Decile 6 | 0.574844 |
| Median | 0.567002 |
| Decile 4 | 0.559095 |
| Decile 3 | 0.550283 |
| Decile 2 | 0.539678 |
| Decile 1 | 0.524618 |
| Minimum | 0 |
|
|
- Mean = 0.56564
- Std.dev = 0.0324429
- 92 items below graph minimum of 0.444041
- 2 items above graph maximum of 0.685771
|
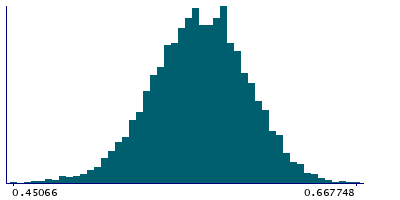
Instance 3 : First repeat imaging visit (2019+)
4,760 participants, 4,760 items
| Maximum | 0.667748 |
| Decile 9 | 0.606844 |
| Decile 8 | 0.593908 |
| Decile 7 | 0.584596 |
| Decile 6 | 0.576954 |
| Median | 0.568807 |
| Decile 4 | 0.561296 |
| Decile 3 | 0.55251 |
| Decile 2 | 0.542697 |
| Decile 1 | 0.528752 |
| Minimum | 0.391256 |
|
|
- Mean = 0.567977
- Std.dev = 0.0311716
- 8 items below graph minimum of 0.45066
|
Notes
Mean FA (fractional anisotropy) in sagittal stratum (left) on FA skeleton (from dMRI data)
0 Related Data-Fields
There are no related data-fields

