Data
64,947 items of data are available, covering 60,419 participants.
Defined-instances run from 2 to 3, labelled using Instancing
2.
Units of measurement are AU.
| Maximum | 0.645566 |
| Decile 9 | 0.563738 |
| Decile 8 | 0.549871 |
| Decile 7 | 0.539619 |
| Decile 6 | 0.530446 |
| Median | 0.521669 |
| Decile 4 | 0.512813 |
| Decile 3 | 0.502855 |
| Decile 2 | 0.490895 |
| Decile 1 | 0.472904 |
| Minimum | 0 |
|
|
- Mean = 0.519489
- Std.dev = 0.0364388
- 117 items below graph minimum of 0.38207
|
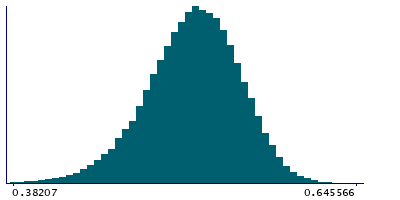
2 Instances
Instance 2 : Imaging visit (2014+)
60,187 participants, 60,187 items
| Maximum | 0.645566 |
| Decile 9 | 0.563581 |
| Decile 8 | 0.549618 |
| Decile 7 | 0.539362 |
| Decile 6 | 0.530197 |
| Median | 0.521364 |
| Decile 4 | 0.512493 |
| Decile 3 | 0.502533 |
| Decile 2 | 0.490464 |
| Decile 1 | 0.472471 |
| Minimum | 0 |
|

|
- Mean = 0.519181
- Std.dev = 0.0365372
- 108 items below graph minimum of 0.38136
|
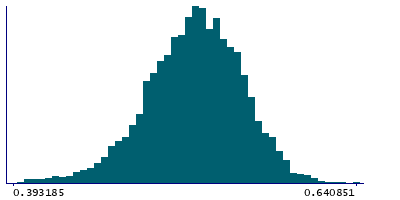
Instance 3 : First repeat imaging visit (2019+)
4,760 participants, 4,760 items
| Maximum | 0.640851 |
| Decile 9 | 0.565587 |
| Decile 8 | 0.552599 |
| Decile 7 | 0.542523 |
| Decile 6 | 0.533514 |
| Median | 0.525177 |
| Decile 4 | 0.516942 |
| Decile 3 | 0.507155 |
| Decile 2 | 0.495731 |
| Decile 1 | 0.479386 |
| Minimum | 0.308458 |
|
|
- Mean = 0.523383
- Std.dev = 0.0349375
- 8 items below graph minimum of 0.393185
|
Notes
Mean FA (fractional anisotropy) in fornix cres+stria terminalis (right) on FA skeleton (from dMRI data)
0 Related Data-Fields
There are no related data-fields

