Data
64,947 items of data are available, covering 60,419 participants.
Defined-instances run from 2 to 3, labelled using Instancing
2.
Units of measurement are AU.
| Maximum | 0.002325 |
| Decile 9 | 0.000904 |
| Decile 8 | 0.000875 |
| Decile 7 | 0.000857 |
| Decile 6 | 0.000843 |
| Median | 0.000832 |
| Decile 4 | 0.00082 |
| Decile 3 | 0.000809 |
| Decile 2 | 0.000797 |
| Decile 1 | 0.000781 |
| Minimum | 0 |
|
|
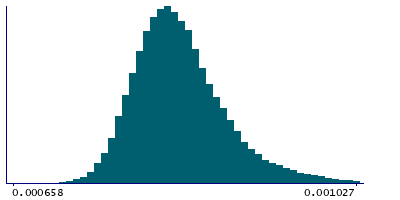
- Mean = 0.000838904
- Std.dev = 5.37988e-05
- 6 items below graph minimum of 0.000658
- 494 items above graph maximum of 0.001027
|
2 Instances
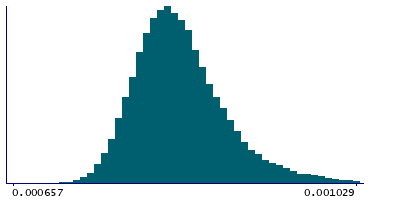
Instance 2 : Imaging visit (2014+)
60,187 participants, 60,187 items
| Maximum | 0.002325 |
| Decile 9 | 0.000905 |
| Decile 8 | 0.000876 |
| Decile 7 | 0.000858 |
| Decile 6 | 0.000844 |
| Median | 0.000832 |
| Decile 4 | 0.000821 |
| Decile 3 | 0.00081 |
| Decile 2 | 0.000798 |
| Decile 1 | 0.000781 |
| Minimum | 0 |
|
|
- Mean = 0.00083968
- Std.dev = 5.40301e-05
- 6 items below graph minimum of 0.000657
- 444 items above graph maximum of 0.001029
|
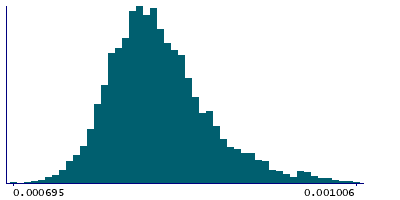
Instance 3 : First repeat imaging visit (2019+)
4,760 participants, 4,760 items
| Maximum | 0.001202 |
| Decile 9 | 0.000891 |
| Decile 8 | 0.000862 |
| Decile 7 | 0.000846 |
| Decile 6 | 0.000833 |
| Median | 0.000822 |
| Decile 4 | 0.000812 |
| Decile 3 | 0.000802 |
| Decile 2 | 0.00079 |
| Decile 1 | 0.000776 |
| Minimum | 0.000695 |
|
|
- Mean = 0.000829089
- Std.dev = 4.97489e-05
- 37 items above graph maximum of 0.001006
|
Notes
Mean MD (mean diffusivity) in posterior thalamic radiation (left) on FA (fractional anisotropy) skeleton (from dMRI data)
0 Related Data-Fields
There are no related data-fields

