Data
83,911 items of data are available, covering 79,384 participants.
Defined-instances run from 2 to 3, labelled using Instancing
2.
Units of measurement are AU.
| Maximum | 0.964897 |
| Decile 9 | 0.930007 |
| Decile 8 | 0.922729 |
| Decile 7 | 0.916985 |
| Decile 6 | 0.911695 |
| Median | 0.906384 |
| Decile 4 | 0.900421 |
| Decile 3 | 0.893461 |
| Decile 2 | 0.883884 |
| Decile 1 | 0.867089 |
| Minimum | -0.049798 |
|
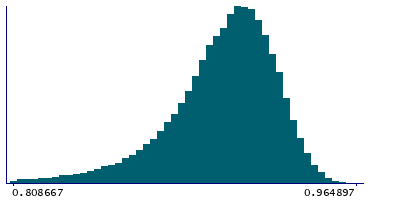
|
- Mean = 0.900825
- Std.dev = 0.0315177
- 1043 items below graph minimum of 0.804171
|
2 Instances
Instance 2 : Imaging visit (2014+)
79,153 participants, 79,153 items
| Maximum | 0.964897 |
| Decile 9 | 0.929941 |
| Decile 8 | 0.922637 |
| Decile 7 | 0.91688 |
| Decile 6 | 0.911574 |
| Median | 0.906263 |
| Decile 4 | 0.900281 |
| Decile 3 | 0.893288 |
| Decile 2 | 0.883676 |
| Decile 1 | 0.866695 |
| Minimum | -0.049798 |
|
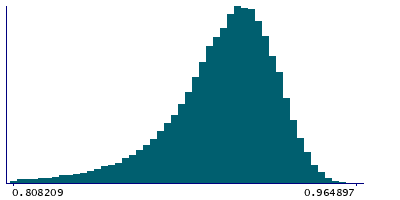
|
- Mean = 0.900663
- Std.dev = 0.0315025
- 984 items below graph minimum of 0.803449
|
Instance 3 : First repeat imaging visit (2019+)
4,758 participants, 4,758 items
| Maximum | 0.95721 |
| Decile 9 | 0.931218 |
| Decile 8 | 0.924265 |
| Decile 7 | 0.918897 |
| Decile 6 | 0.913666 |
| Median | 0.908233 |
| Decile 4 | 0.902405 |
| Decile 3 | 0.895902 |
| Decile 2 | 0.887156 |
| Decile 1 | 0.872351 |
| Minimum | 0.11686 |
|
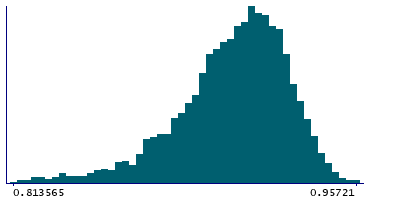
|
- Mean = 0.903506
- Std.dev = 0.0316503
- 51 items below graph minimum of 0.813484
|
Notes
Mean MO (diffusion tensor mode) in genu of corpus callosum on FA (fractional anisotropy) skeleton (from dMRI data)
0 Related Data-Fields
There are no related data-fields

