Data
83,911 items of data are available, covering 79,384 participants.
Defined-instances run from 2 to 3, labelled using Instancing
2.
Units of measurement are AU.
| Maximum | 0.842471 |
| Decile 9 | 0.695962 |
| Decile 8 | 0.669196 |
| Decile 7 | 0.648103 |
| Decile 6 | 0.629226 |
| Median | 0.61039 |
| Decile 4 | 0.591076 |
| Decile 3 | 0.56829 |
| Decile 2 | 0.538527 |
| Decile 1 | 0.48829 |
| Minimum | -0.255498 |
|
|
- Mean = 0.596514
- Std.dev = 0.0950263
- 1097 items below graph minimum of 0.280619
|
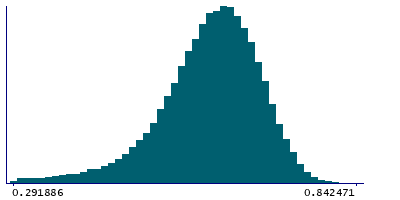
2 Instances
Instance 2 : Imaging visit (2014+)
79,153 participants, 79,153 items
| Maximum | 0.842471 |
| Decile 9 | 0.695858 |
| Decile 8 | 0.669019 |
| Decile 7 | 0.64793 |
| Decile 6 | 0.629069 |
| Median | 0.610217 |
| Decile 4 | 0.590846 |
| Decile 3 | 0.567997 |
| Decile 2 | 0.538172 |
| Decile 1 | 0.487717 |
| Minimum | -0.255498 |
|

|
- Mean = 0.596283
- Std.dev = 0.0950342
- 1019 items below graph minimum of 0.279576
|
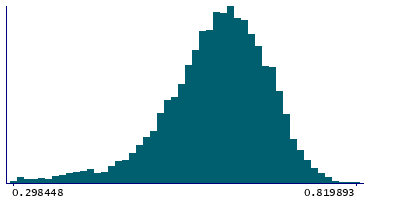
Instance 3 : First repeat imaging visit (2019+)
4,758 participants, 4,758 items
| Maximum | 0.819893 |
| Decile 9 | 0.697809 |
| Decile 8 | 0.67176 |
| Decile 7 | 0.650921 |
| Decile 6 | 0.631916 |
| Median | 0.613879 |
| Decile 4 | 0.594737 |
| Decile 3 | 0.573877 |
| Decile 2 | 0.545005 |
| Decile 1 | 0.498063 |
| Minimum | -0.064721 |
|
|
- Mean = 0.600343
- Std.dev = 0.0948129
- 71 items below graph minimum of 0.298318
|
Notes
Mean MO (diffusion tensor mode) in inferior cerebellar peduncle (left) on FA (fractional anisotropy) skeleton (from dMRI data)
0 Related Data-Fields
There are no related data-fields

