Data
83,911 items of data are available, covering 79,384 participants.
Defined-instances run from 2 to 3, labelled using Instancing
2.
Units of measurement are AU.
| Maximum | 0.853542 |
| Decile 9 | 0.735618 |
| Decile 8 | 0.706579 |
| Decile 7 | 0.684057 |
| Decile 6 | 0.664327 |
| Median | 0.64534 |
| Decile 4 | 0.626229 |
| Decile 3 | 0.605493 |
| Decile 2 | 0.580889 |
| Decile 1 | 0.545471 |
| Minimum | 0.051881 |
|
|
- Mean = 0.641862
- Std.dev = 0.0744359
- 82 items below graph minimum of 0.355325
|
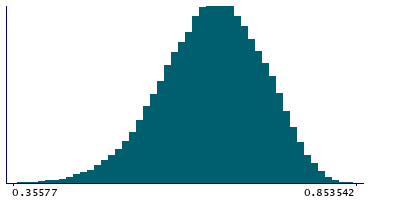
2 Instances
Instance 2 : Imaging visit (2014+)
79,153 participants, 79,153 items
| Maximum | 0.853542 |
| Decile 9 | 0.735479 |
| Decile 8 | 0.706431 |
| Decile 7 | 0.68385 |
| Decile 6 | 0.664109 |
| Median | 0.64519 |
| Decile 4 | 0.626076 |
| Decile 3 | 0.605256 |
| Decile 2 | 0.580643 |
| Decile 1 | 0.545181 |
| Minimum | 0.051881 |
|

|
- Mean = 0.641699
- Std.dev = 0.0744288
- 74 items below graph minimum of 0.354882
|
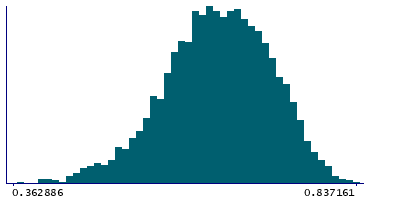
Instance 3 : First repeat imaging visit (2019+)
4,758 participants, 4,758 items
| Maximum | 0.837161 |
| Decile 9 | 0.737614 |
| Decile 8 | 0.709677 |
| Decile 7 | 0.687473 |
| Decile 6 | 0.667812 |
| Median | 0.647839 |
| Decile 4 | 0.628504 |
| Decile 3 | 0.609283 |
| Decile 2 | 0.585184 |
| Decile 1 | 0.55025 |
| Minimum | 0.16769 |
|
|
- Mean = 0.64458
- Std.dev = 0.0745011
- 6 items below graph minimum of 0.362886
|
Notes
Mean MO (diffusion tensor mode) in anterior corona radiata (right) on FA (fractional anisotropy) skeleton (from dMRI data)
0 Related Data-Fields
There are no related data-fields

