Data
83,911 items of data are available, covering 79,384 participants.
Defined-instances run from 2 to 3, labelled using Instancing
2.
Units of measurement are AU.
| Maximum | 0.962906 |
| Decile 9 | 0.883205 |
| Decile 8 | 0.861585 |
| Decile 7 | 0.842972 |
| Decile 6 | 0.824763 |
| Median | 0.805243 |
| Decile 4 | 0.782555 |
| Decile 3 | 0.753234 |
| Decile 2 | 0.709755 |
| Decile 1 | 0.617825 |
| Minimum | -0.253631 |
|

|
- Mean = 0.769684
- Std.dev = 0.132343
- 1842 items below graph minimum of 0.352445
|
2 Instances
Instance 2 : Imaging visit (2014+)
79,153 participants, 79,153 items
| Maximum | 0.962906 |
| Decile 9 | 0.883217 |
| Decile 8 | 0.861615 |
| Decile 7 | 0.842974 |
| Decile 6 | 0.824735 |
| Median | 0.805158 |
| Decile 4 | 0.782391 |
| Decile 3 | 0.75293 |
| Decile 2 | 0.709294 |
| Decile 1 | 0.616612 |
| Minimum | -0.253631 |
|

|
- Mean = 0.769344
- Std.dev = 0.132958
- 1740 items below graph minimum of 0.350007
|
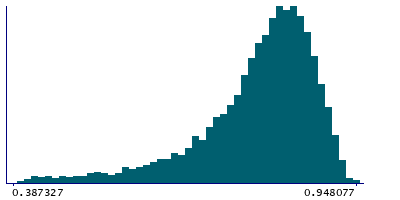
Instance 3 : First repeat imaging visit (2019+)
4,758 participants, 4,758 items
| Maximum | 0.948077 |
| Decile 9 | 0.88288 |
| Decile 8 | 0.860805 |
| Decile 7 | 0.842858 |
| Decile 6 | 0.824956 |
| Median | 0.806312 |
| Decile 4 | 0.785098 |
| Decile 3 | 0.758133 |
| Decile 2 | 0.716685 |
| Decile 1 | 0.634903 |
| Minimum | -0.160648 |
|
|
- Mean = 0.775355
- Std.dev = 0.121532
- 93 items below graph minimum of 0.386926
|
Notes
Mean MO (diffusion tensor mode) in superior fronto-occipital fasciculus (right) on FA (fractional anisotropy) skeleton (from dMRI data)
0 Related Data-Fields
There are no related data-fields

