Data
83,911 items of data are available, covering 79,384 participants.
Defined-instances run from 2 to 3, labelled using Instancing
2.
Units of measurement are AU.
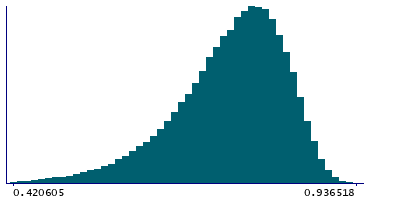
| Maximum | 0.948738 |
| Decile 9 | 0.837993 |
| Decile 8 | 0.813446 |
| Decile 7 | 0.793339 |
| Decile 6 | 0.77435 |
| Median | 0.754591 |
| Decile 4 | 0.733084 |
| Decile 3 | 0.708422 |
| Decile 2 | 0.675717 |
| Decile 1 | 0.623888 |
| Minimum | -0.436139 |
|
|
- Mean = 0.740153
- Std.dev = 0.0886585
- 348 items below graph minimum of 0.409783
|
2 Instances
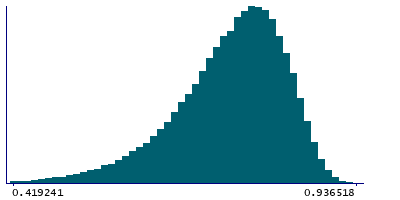
Instance 2 : Imaging visit (2014+)
79,153 participants, 79,153 items
| Maximum | 0.948738 |
| Decile 9 | 0.837607 |
| Decile 8 | 0.812868 |
| Decile 7 | 0.792779 |
| Decile 6 | 0.773764 |
| Median | 0.754012 |
| Decile 4 | 0.732518 |
| Decile 3 | 0.707637 |
| Decile 2 | 0.674967 |
| Decile 1 | 0.622823 |
| Minimum | -0.436139 |
|
|
- Mean = 0.739467
- Std.dev = 0.0888792
- 322 items below graph minimum of 0.40804
|
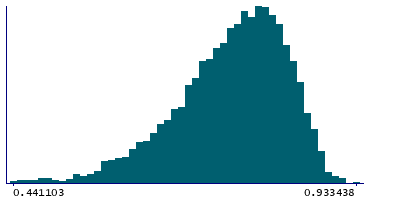
Instance 3 : First repeat imaging visit (2019+)
4,758 participants, 4,758 items
| Maximum | 0.933438 |
| Decile 9 | 0.844801 |
| Decile 8 | 0.82138 |
| Decile 7 | 0.802243 |
| Decile 6 | 0.783415 |
| Median | 0.764914 |
| Decile 4 | 0.743629 |
| Decile 3 | 0.719074 |
| Decile 2 | 0.690514 |
| Decile 1 | 0.642973 |
| Minimum | -0.239184 |
|
|
- Mean = 0.751561
- Std.dev = 0.0840865
- 22 items below graph minimum of 0.441146
|
Notes
Mean MO (diffusion tensor mode) in uncinate fasciculus (right) on FA (fractional anisotropy) skeleton (from dMRI data)
0 Related Data-Fields
There are no related data-fields

