Data
83,911 items of data are available, covering 79,384 participants.
Defined-instances run from 2 to 3, labelled using Instancing
2.
Units of measurement are AU.
| Maximum | 0.989789 |
| Decile 9 | 0.93528 |
| Decile 8 | 0.918396 |
| Decile 7 | 0.902634 |
| Decile 6 | 0.887135 |
| Median | 0.870467 |
| Decile 4 | 0.850845 |
| Decile 3 | 0.826164 |
| Decile 2 | 0.791311 |
| Decile 1 | 0.731981 |
| Minimum | -0.328961 |
|

|
- Mean = 0.847342
- Std.dev = 0.0929429
- 948 items below graph minimum of 0.528682
|
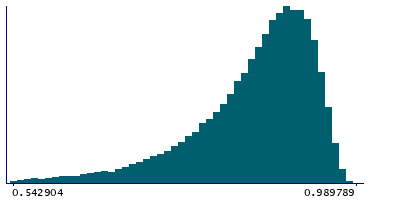
2 Instances
Instance 2 : Imaging visit (2014+)
79,153 participants, 79,153 items
| Maximum | 0.989789 |
| Decile 9 | 0.935443 |
| Decile 8 | 0.918578 |
| Decile 7 | 0.902716 |
| Decile 6 | 0.887226 |
| Median | 0.870558 |
| Decile 4 | 0.850976 |
| Decile 3 | 0.826253 |
| Decile 2 | 0.791237 |
| Decile 1 | 0.732021 |
| Minimum | -0.328961 |
|
|
- Mean = 0.847438
- Std.dev = 0.0929304
- 893 items below graph minimum of 0.528599
|
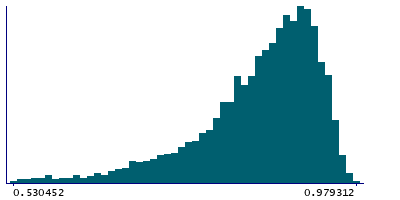
Instance 3 : First repeat imaging visit (2019+)
4,758 participants, 4,758 items
| Maximum | 0.979312 |
| Decile 9 | 0.9324 |
| Decile 8 | 0.915718 |
| Decile 7 | 0.901276 |
| Decile 6 | 0.885788 |
| Median | 0.868537 |
| Decile 4 | 0.848978 |
| Decile 3 | 0.824812 |
| Decile 2 | 0.792612 |
| Decile 1 | 0.731413 |
| Minimum | -0.304074 |
|
|
- Mean = 0.845748
- Std.dev = 0.0931352
- 58 items below graph minimum of 0.530425
|
Notes
Mean MO (diffusion tensor mode) in tapetum (right) on FA (fractional anisotropy) skeleton (from dMRI data)
0 Related Data-Fields
There are no related data-fields

