Data
83,911 items of data are available, covering 79,384 participants.
Defined-instances run from 2 to 3, labelled using Instancing
2.
Units of measurement are AU.
| Maximum | 0.002815 |
| Decile 9 | 0.001289 |
| Decile 8 | 0.001269 |
| Decile 7 | 0.001256 |
| Decile 6 | 0.001244 |
| Median | 0.001233 |
| Decile 4 | 0.001222 |
| Decile 3 | 0.001211 |
| Decile 2 | 0.001197 |
| Decile 1 | 0.001178 |
| Minimum | 0 |
|

|
- Mean = 0.00123302
- Std.dev = 4.87734e-05
- 226 items below graph minimum of 0.001067
- 171 items above graph maximum of 0.0014
|
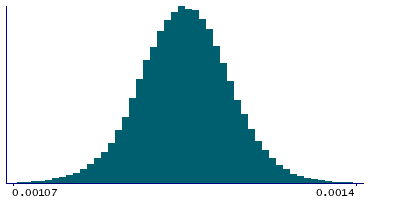
2 Instances
Instance 2 : Imaging visit (2014+)
79,153 participants, 79,153 items
| Maximum | 0.002815 |
| Decile 9 | 0.001289 |
| Decile 8 | 0.001269 |
| Decile 7 | 0.001256 |
| Decile 6 | 0.001244 |
| Median | 0.001233 |
| Decile 4 | 0.001223 |
| Decile 3 | 0.001211 |
| Decile 2 | 0.001198 |
| Decile 1 | 0.001178 |
| Minimum | 0 |
|
|
- Mean = 0.00123337
- Std.dev = 4.88487e-05
- 208 items below graph minimum of 0.001067
- 164 items above graph maximum of 0.0014
|
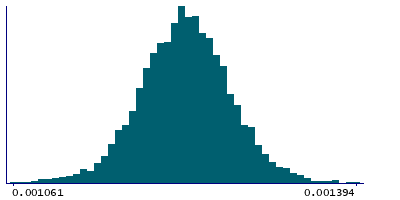
Instance 3 : First repeat imaging visit (2019+)
4,758 participants, 4,758 items
| Maximum | 0.001535 |
| Decile 9 | 0.001283 |
| Decile 8 | 0.001263 |
| Decile 7 | 0.00125 |
| Decile 6 | 0.001238 |
| Median | 0.001228 |
| Decile 4 | 0.001217 |
| Decile 3 | 0.001205 |
| Decile 2 | 0.001192 |
| Decile 1 | 0.001172 |
| Minimum | 0.000928 |
|
|
- Mean = 0.00122719
- Std.dev = 4.71227e-05
- 16 items below graph minimum of 0.001061
- 7 items above graph maximum of 0.001394
|
Notes
Mean L1 in inferior cerebellar peduncle (left) on FA (fractional anisotropy) skeleton (from dMRI data)
0 Related Data-Fields
There are no related data-fields

