Data
83,911 items of data are available, covering 79,384 participants.
Defined-instances run from 2 to 3, labelled using Instancing
2.
Units of measurement are AU.
| Maximum | 0.001828 |
| Decile 9 | 0.001495 |
| Decile 8 | 0.001472 |
| Decile 7 | 0.001455 |
| Decile 6 | 0.001441 |
| Median | 0.001428 |
| Decile 4 | 0.001415 |
| Decile 3 | 0.001401 |
| Decile 2 | 0.001384 |
| Decile 1 | 0.001361 |
| Minimum | 0 |
|
|
- Mean = 0.00142772
- Std.dev = 5.46597e-05
- 61 items below graph minimum of 0.001227
- 21 items above graph maximum of 0.001629
|
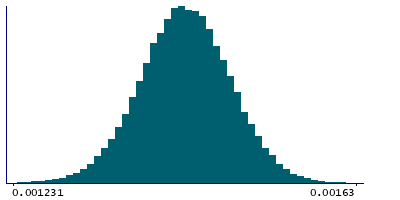
2 Instances
Instance 2 : Imaging visit (2014+)
79,153 participants, 79,153 items
| Maximum | 0.001828 |
| Decile 9 | 0.001495 |
| Decile 8 | 0.001472 |
| Decile 7 | 0.001455 |
| Decile 6 | 0.001441 |
| Median | 0.001428 |
| Decile 4 | 0.001415 |
| Decile 3 | 0.001401 |
| Decile 2 | 0.001384 |
| Decile 1 | 0.001361 |
| Minimum | 0 |
|

|
- Mean = 0.00142779
- Std.dev = 5.4778e-05
- 58 items below graph minimum of 0.001227
- 21 items above graph maximum of 0.001629
|
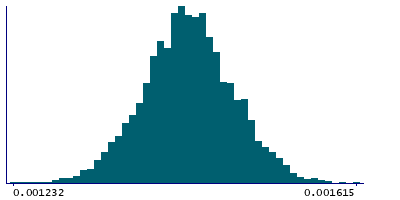
Instance 3 : First repeat imaging visit (2019+)
4,758 participants, 4,758 items
| Maximum | 0.001615 |
| Decile 9 | 0.001492 |
| Decile 8 | 0.001469 |
| Decile 7 | 0.001452 |
| Decile 6 | 0.001439 |
| Median | 0.001427 |
| Decile 4 | 0.001415 |
| Decile 3 | 0.001401 |
| Decile 2 | 0.0013865 |
| Decile 1 | 0.001362 |
| Minimum | 0.000737 |
|
|
- Mean = 0.00142656
- Std.dev = 5.26387e-05
- 5 items below graph minimum of 0.001232
|
Notes
Mean L1 in cerebral peduncle (left) on FA (fractional anisotropy) skeleton (from dMRI data)
0 Related Data-Fields
There are no related data-fields

